Download Options

Book Title

Command Reference BookMap-1

Chapter Title

This is a command wrapper topic

Cisco DNA Center Assurance Demo Zone Guide
Published: August 12, 2022
    About

    About

    About This Instant Demo

    Note: You must use Cisco DNA Center in incognito mode in Google Chrome.

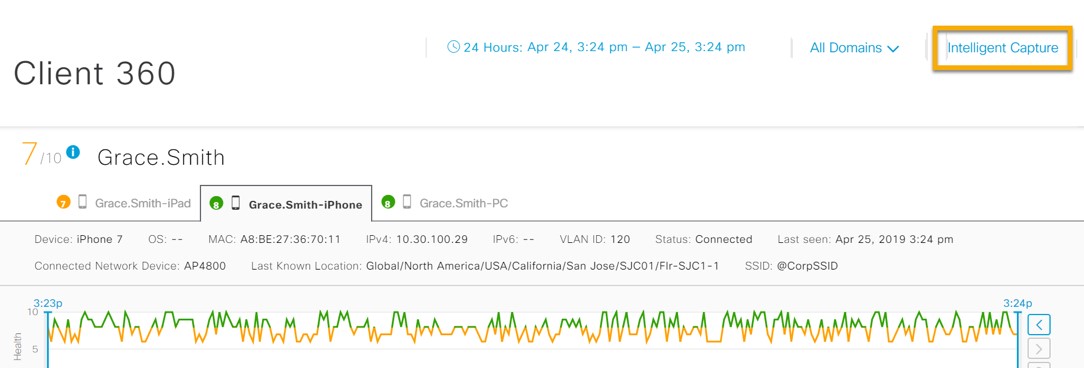
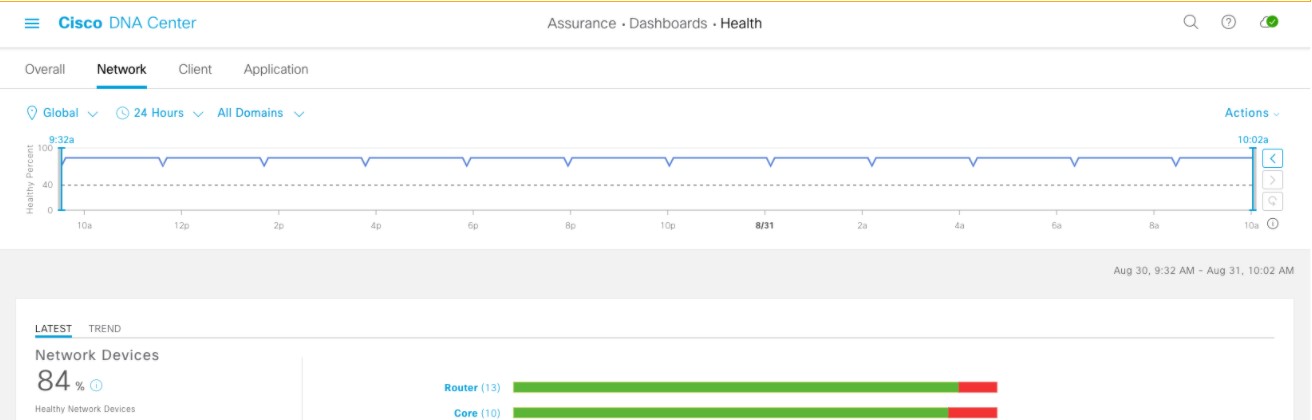
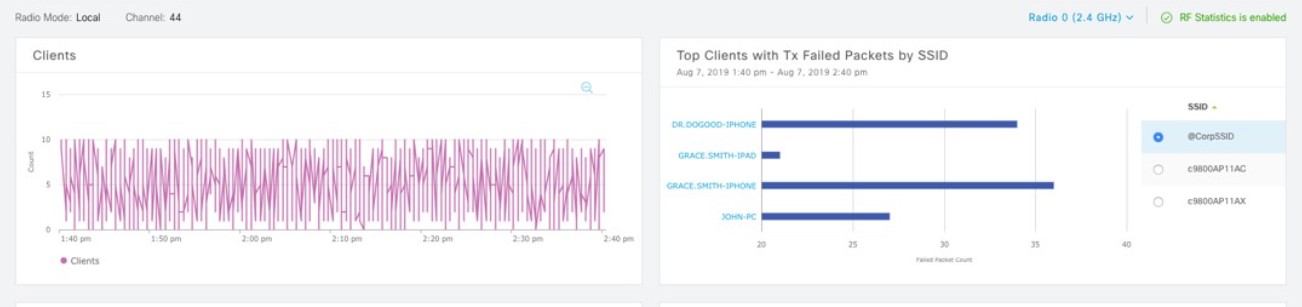
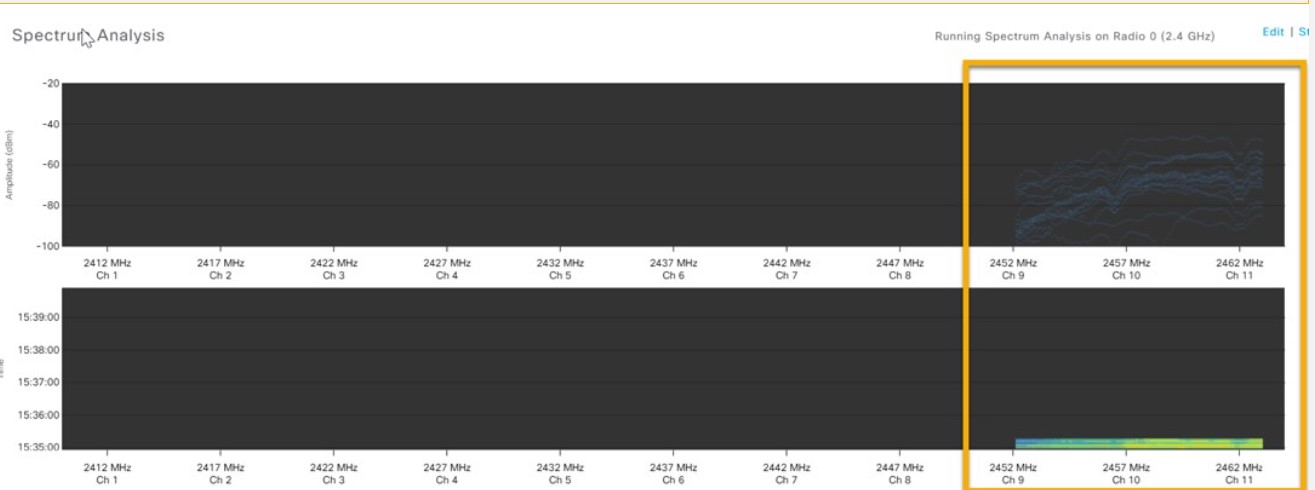
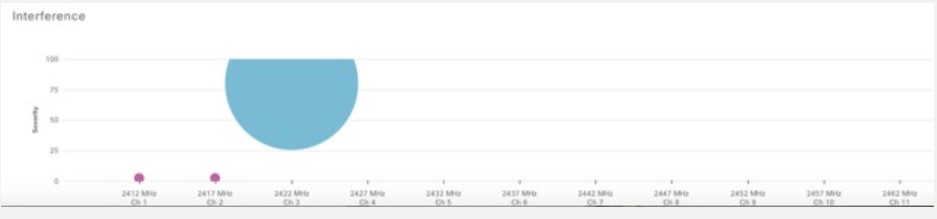
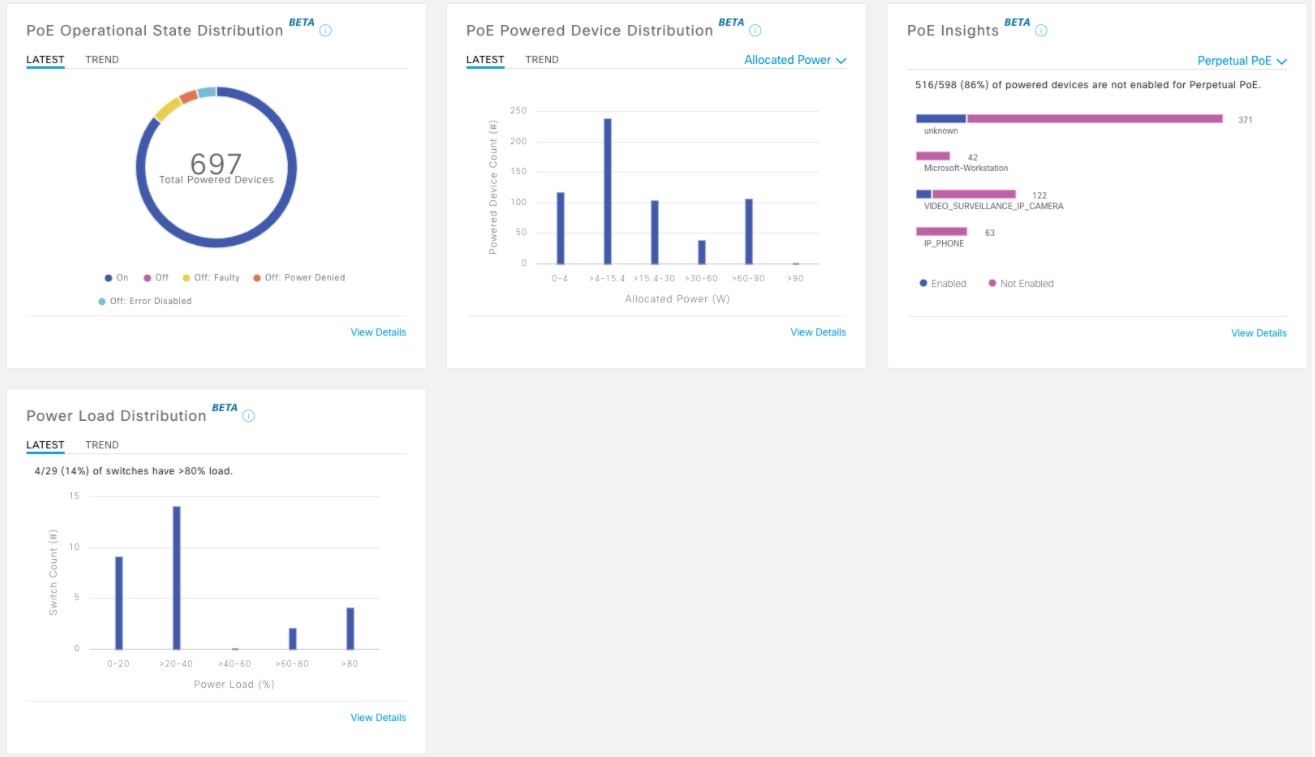
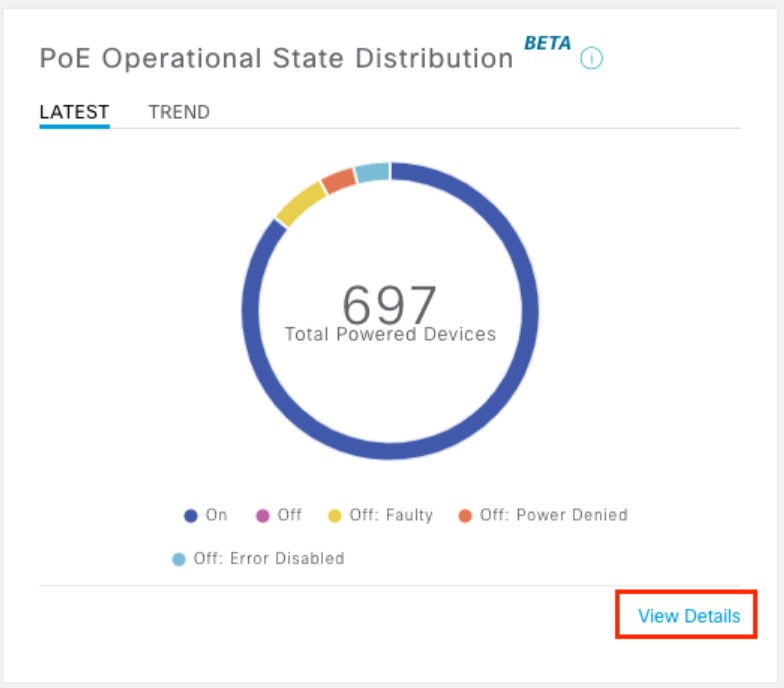
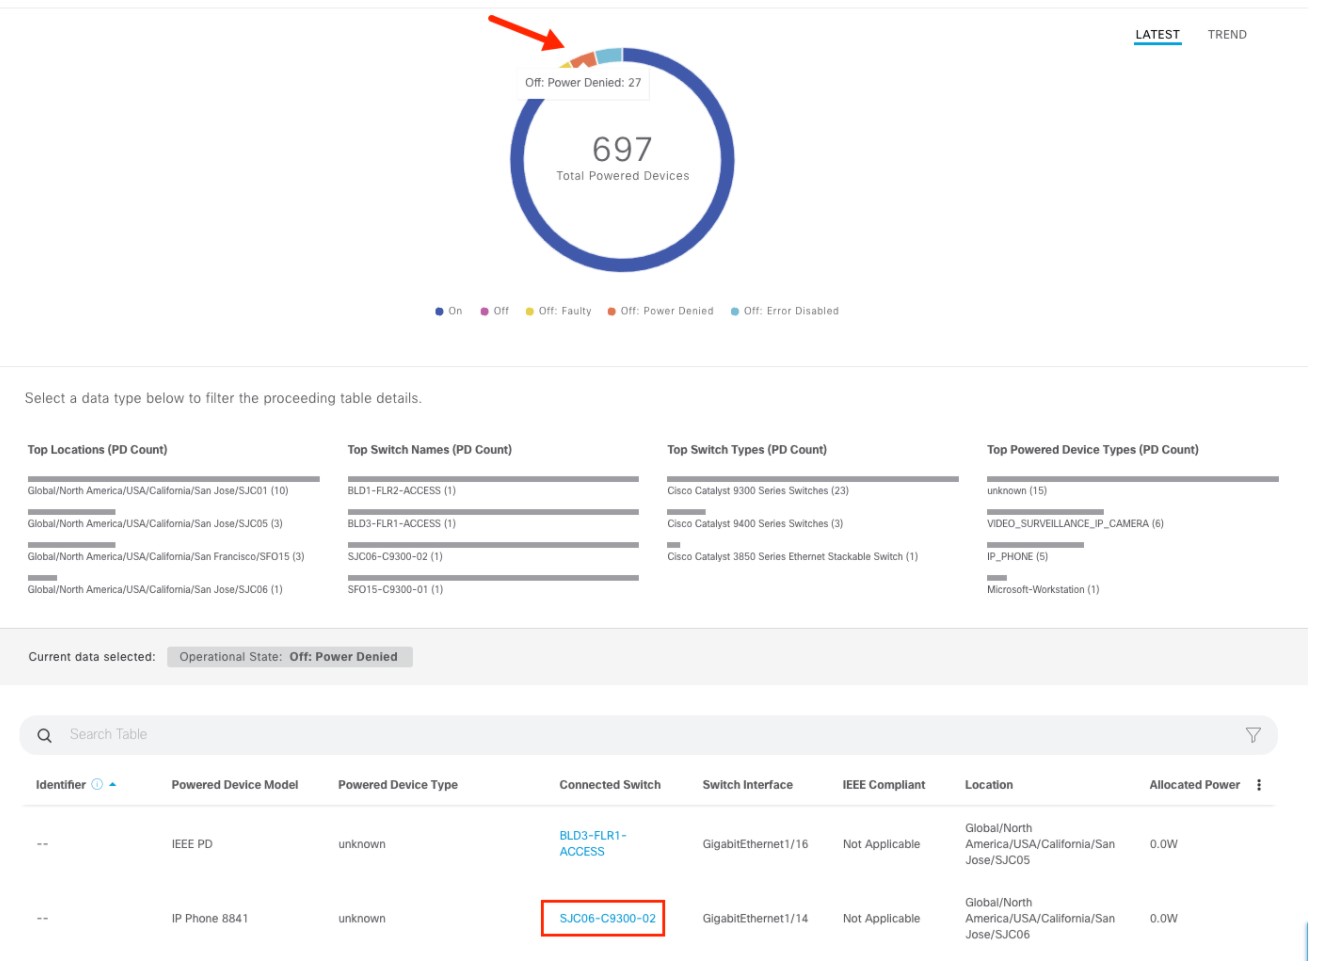
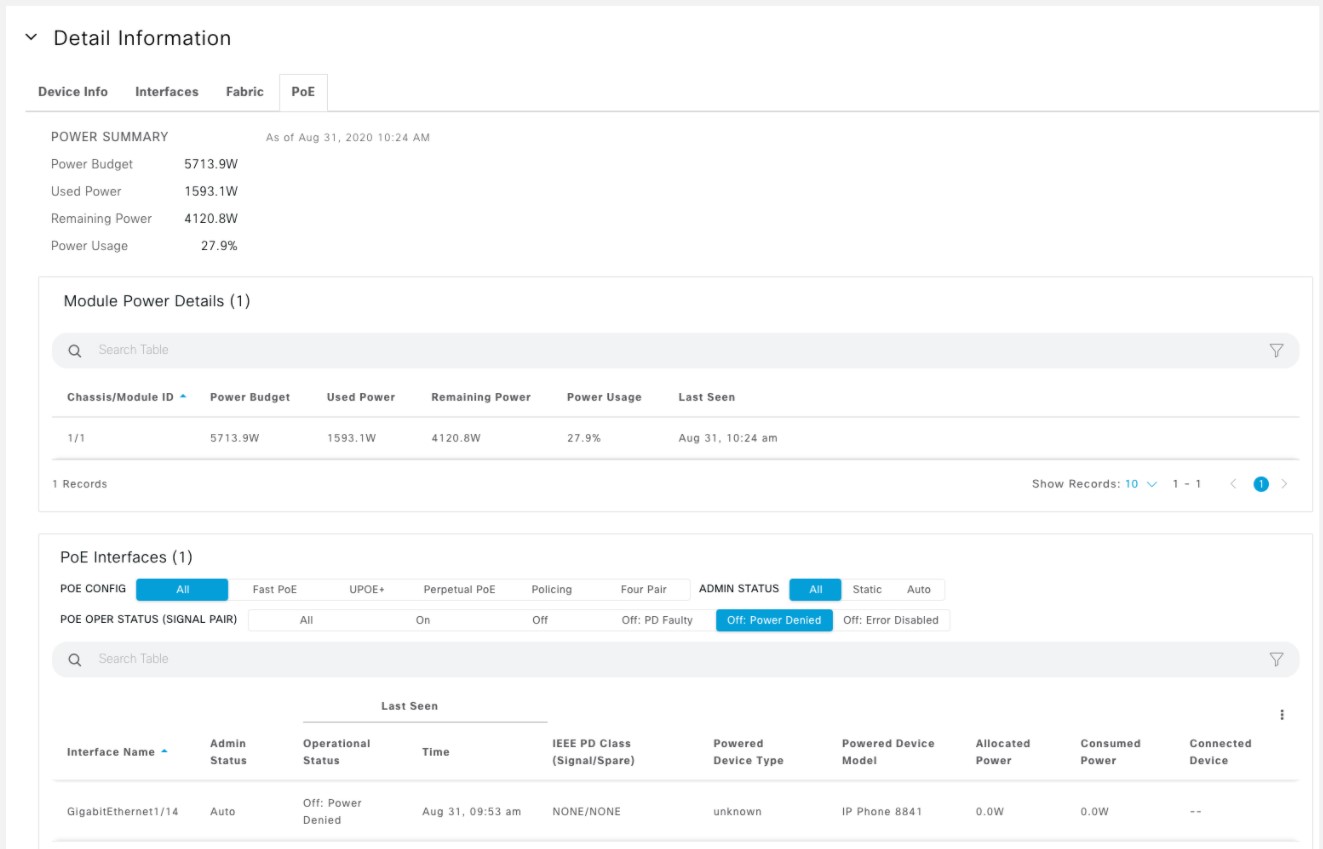
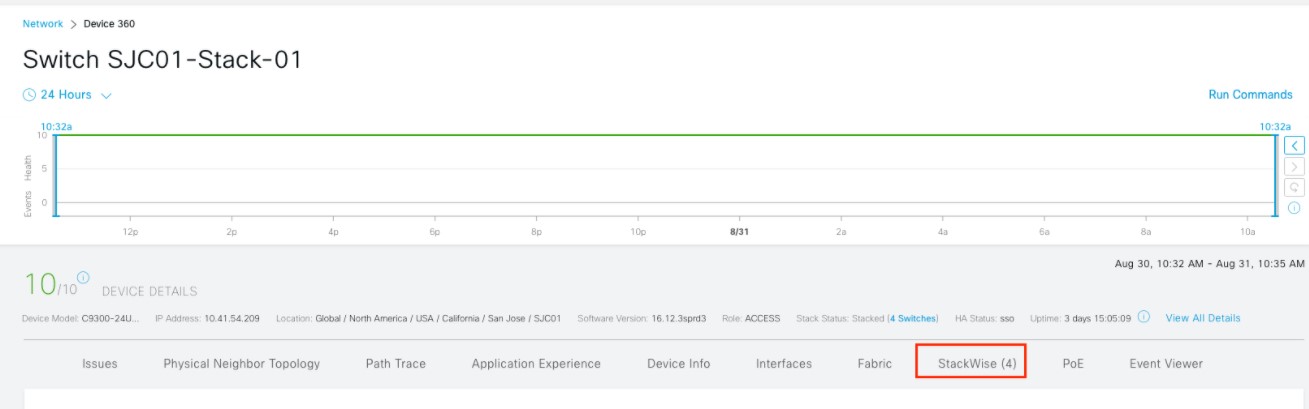
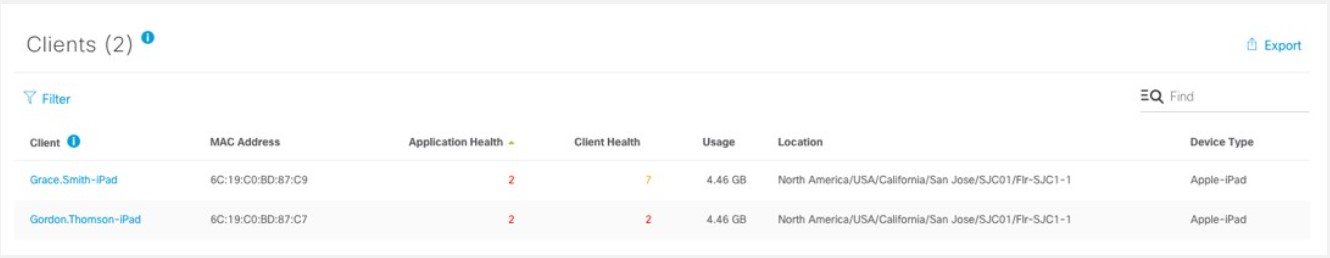
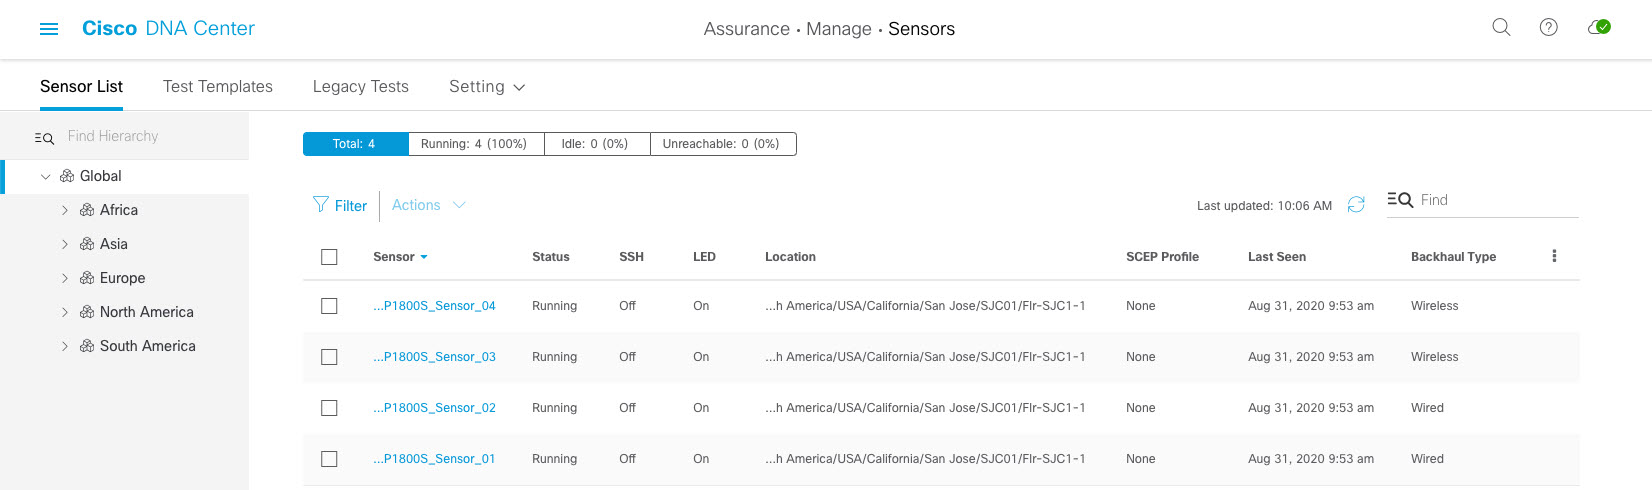
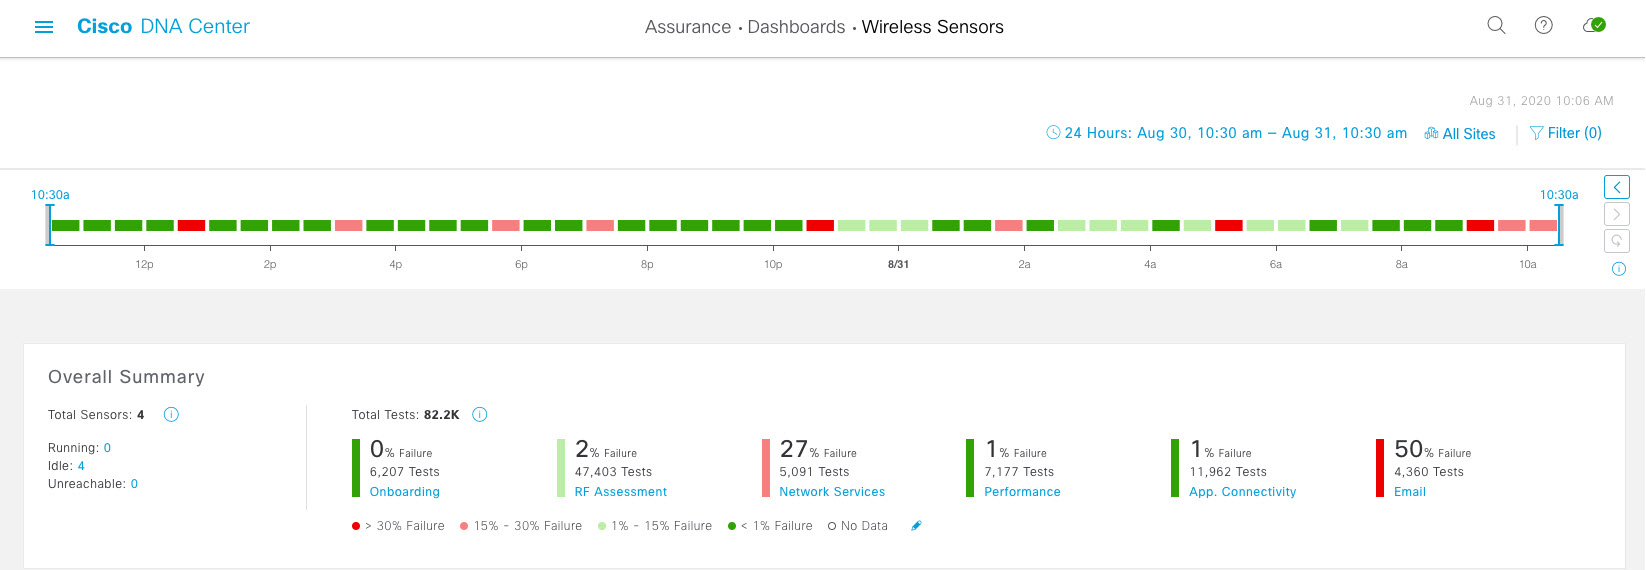
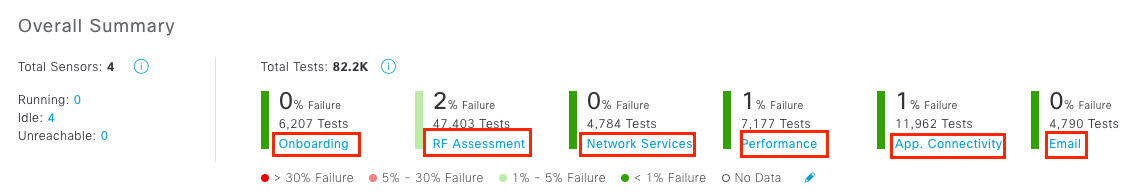
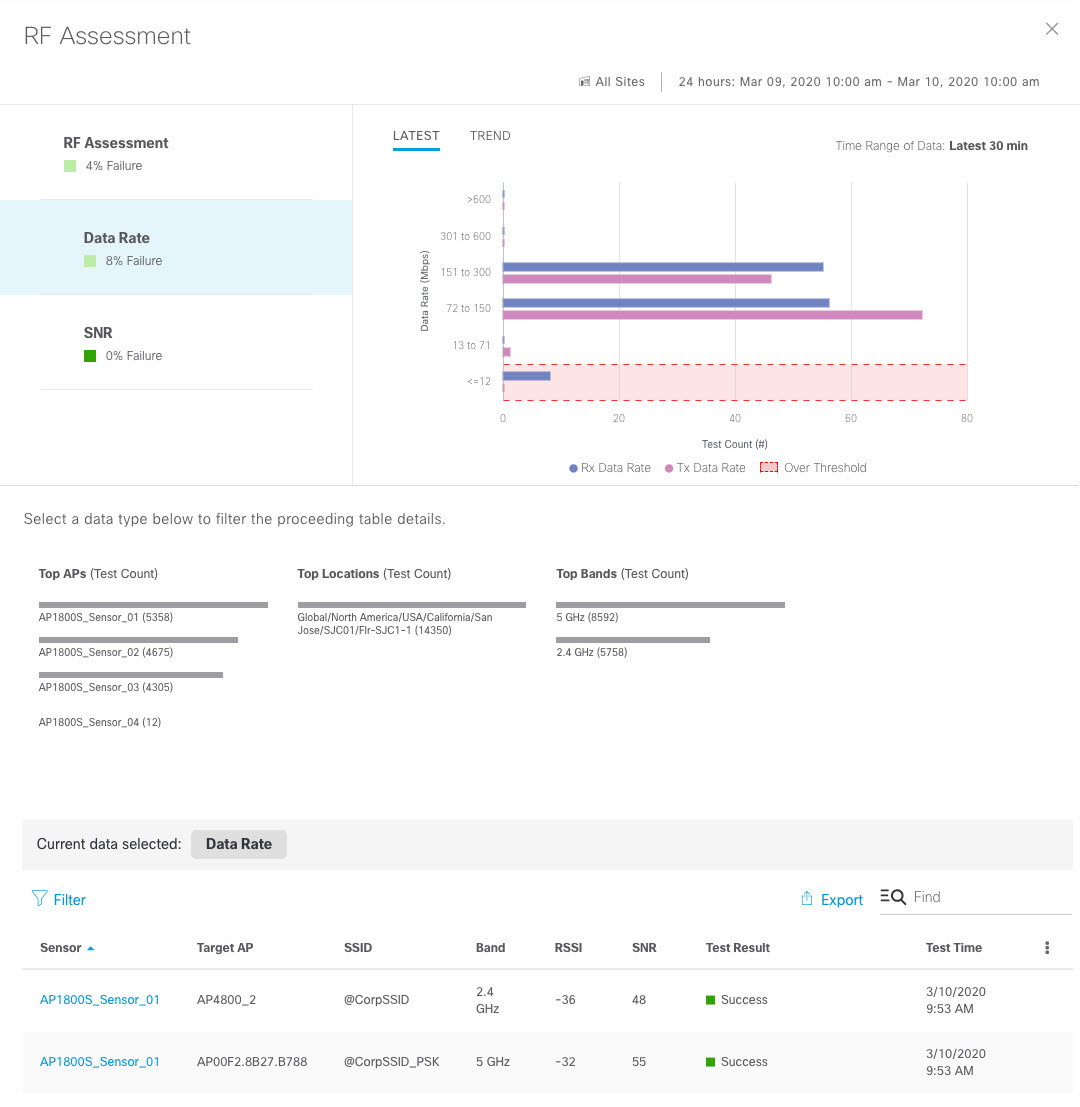
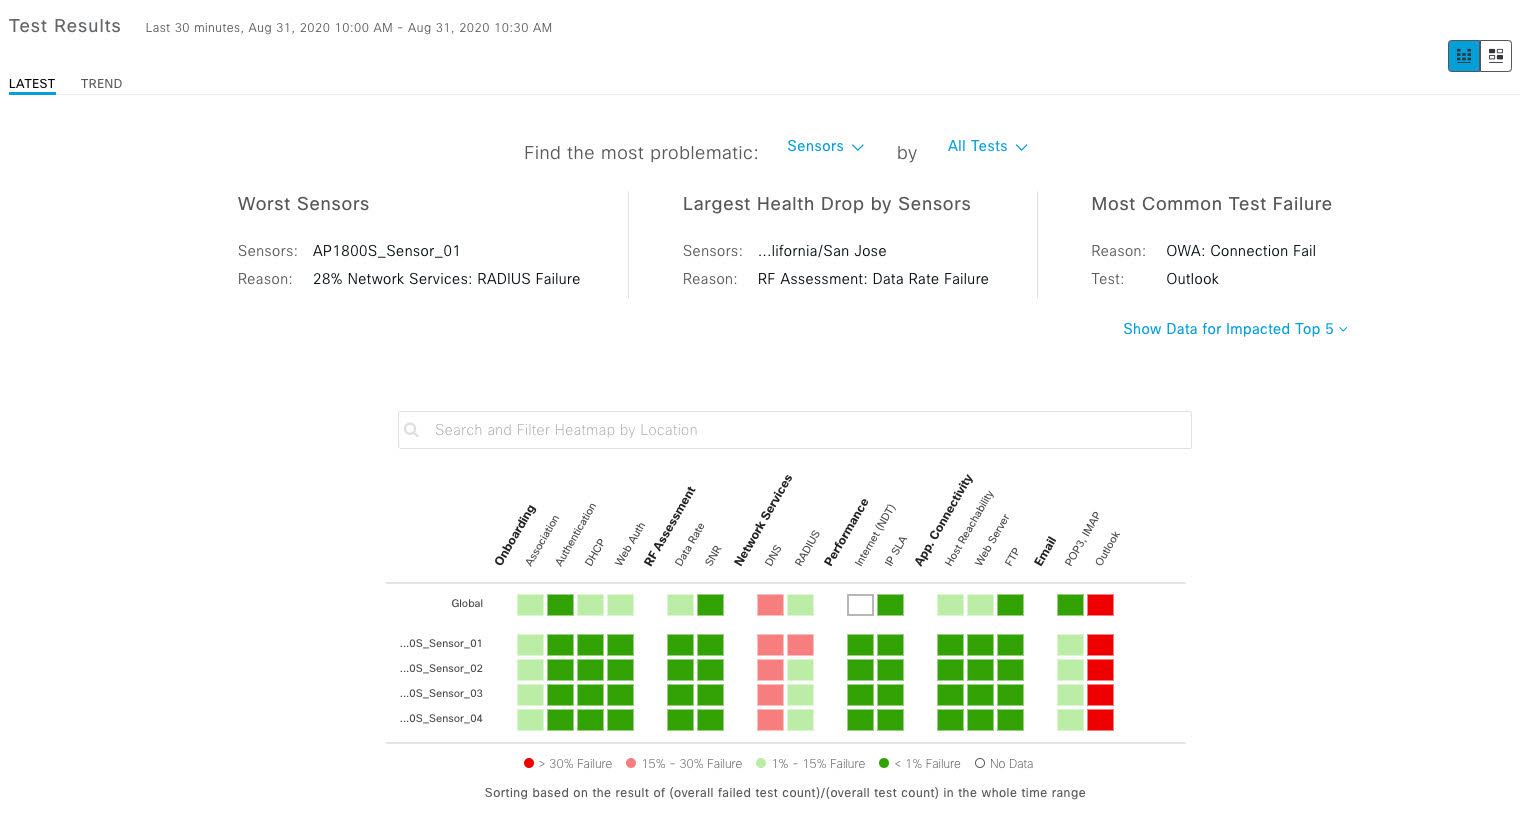
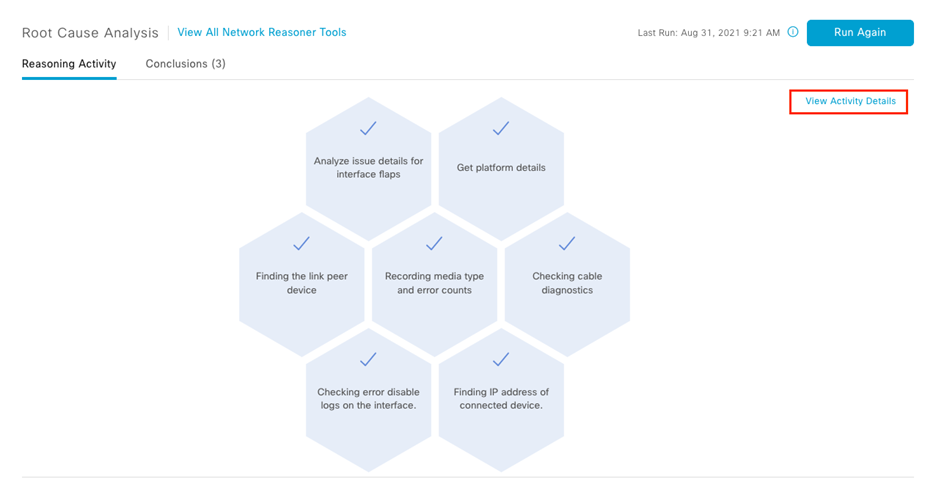
    Cisco DNA Center is the foundational controller and analytics platform at the heart of Cisco’s intent-based network. It supports the expression of intent for multiple use cases, including base automation capabilities, fabric provisioning, and policy-based segmentation in the enterprise network. Cisco DNA Center brings context to this journey through the introduction of Analytics and Assurance by providing end-to-end visibility into the network with full context through data and insights.

    About This Solution

    Cisco DNA Center enables the network administrator to:

    • Design your network using intuitive workflows

    • Define user and device profiles that facilitate secure access and network segmentation based on business needs

    • Policy-based automation to deliver services to the network based on business priority and to simply device deployment

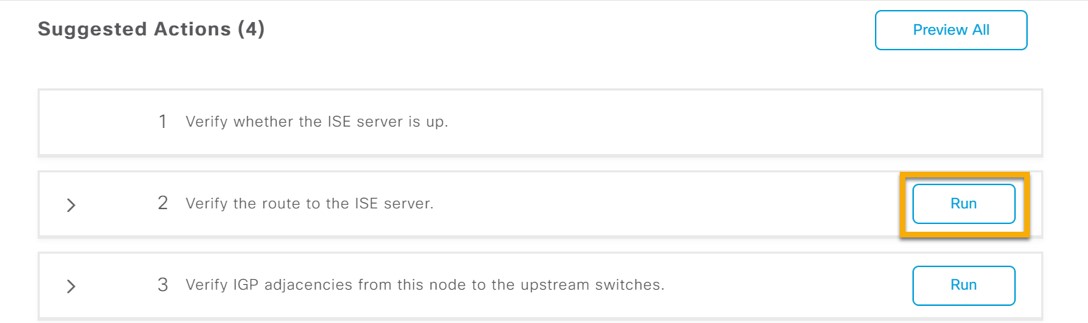
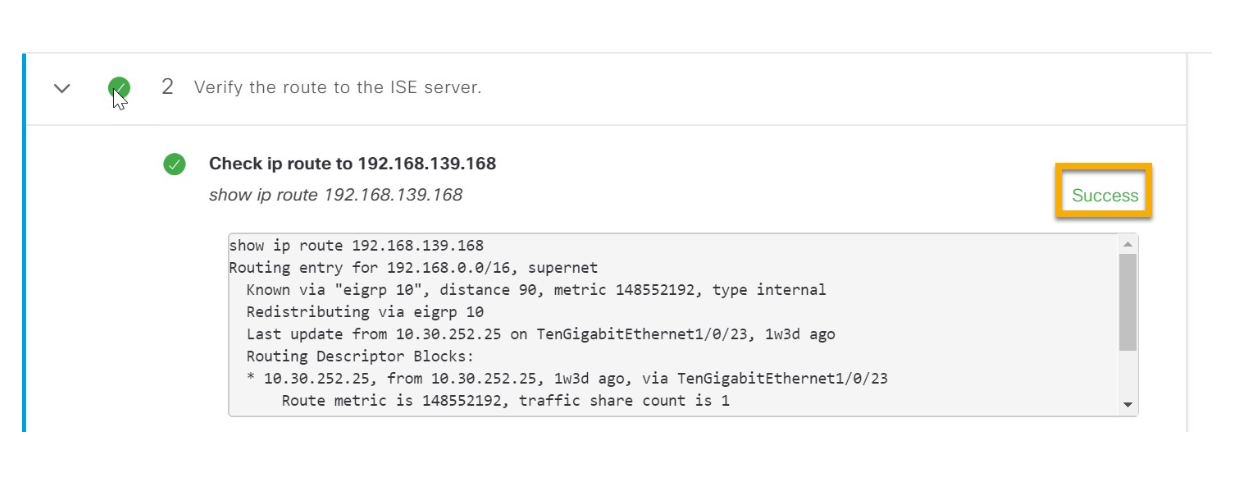
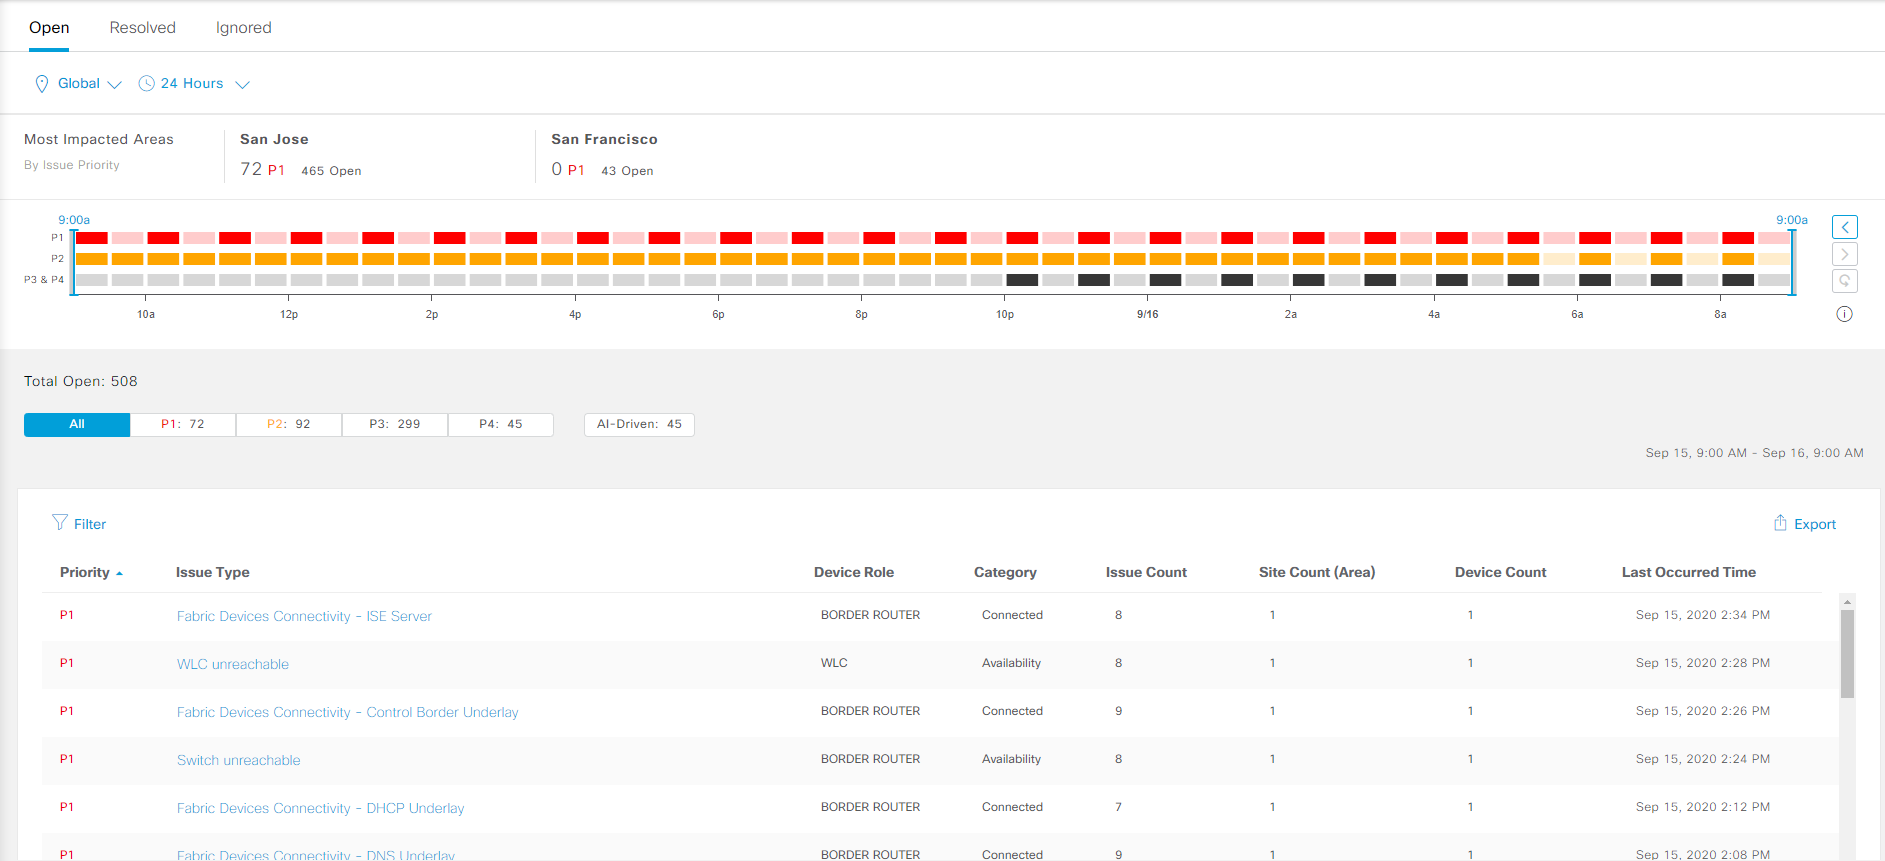
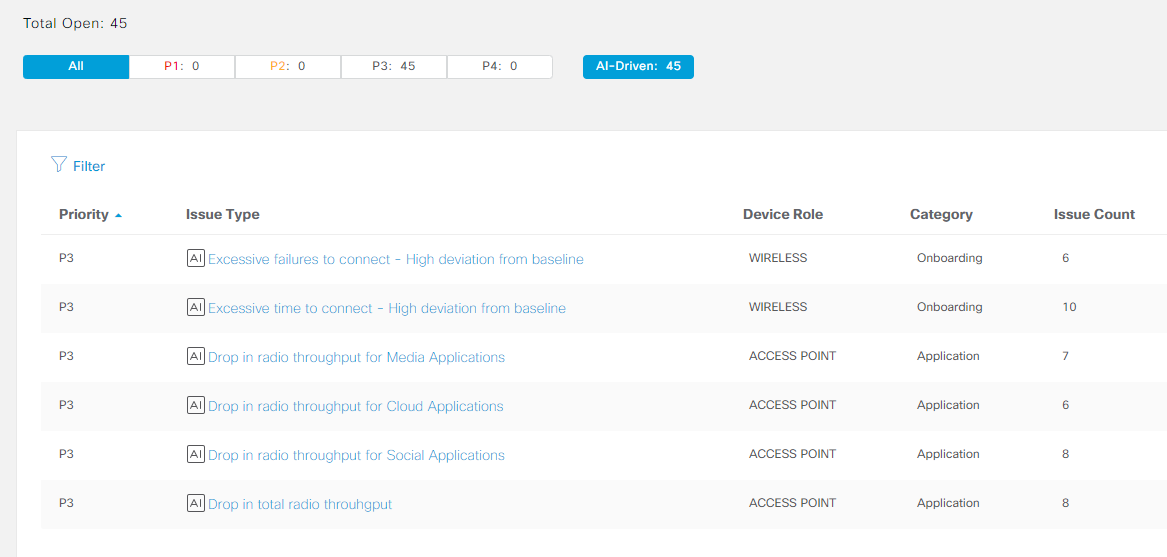
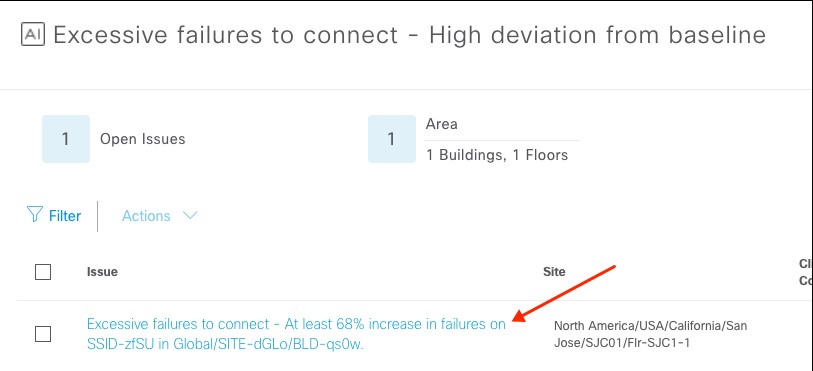
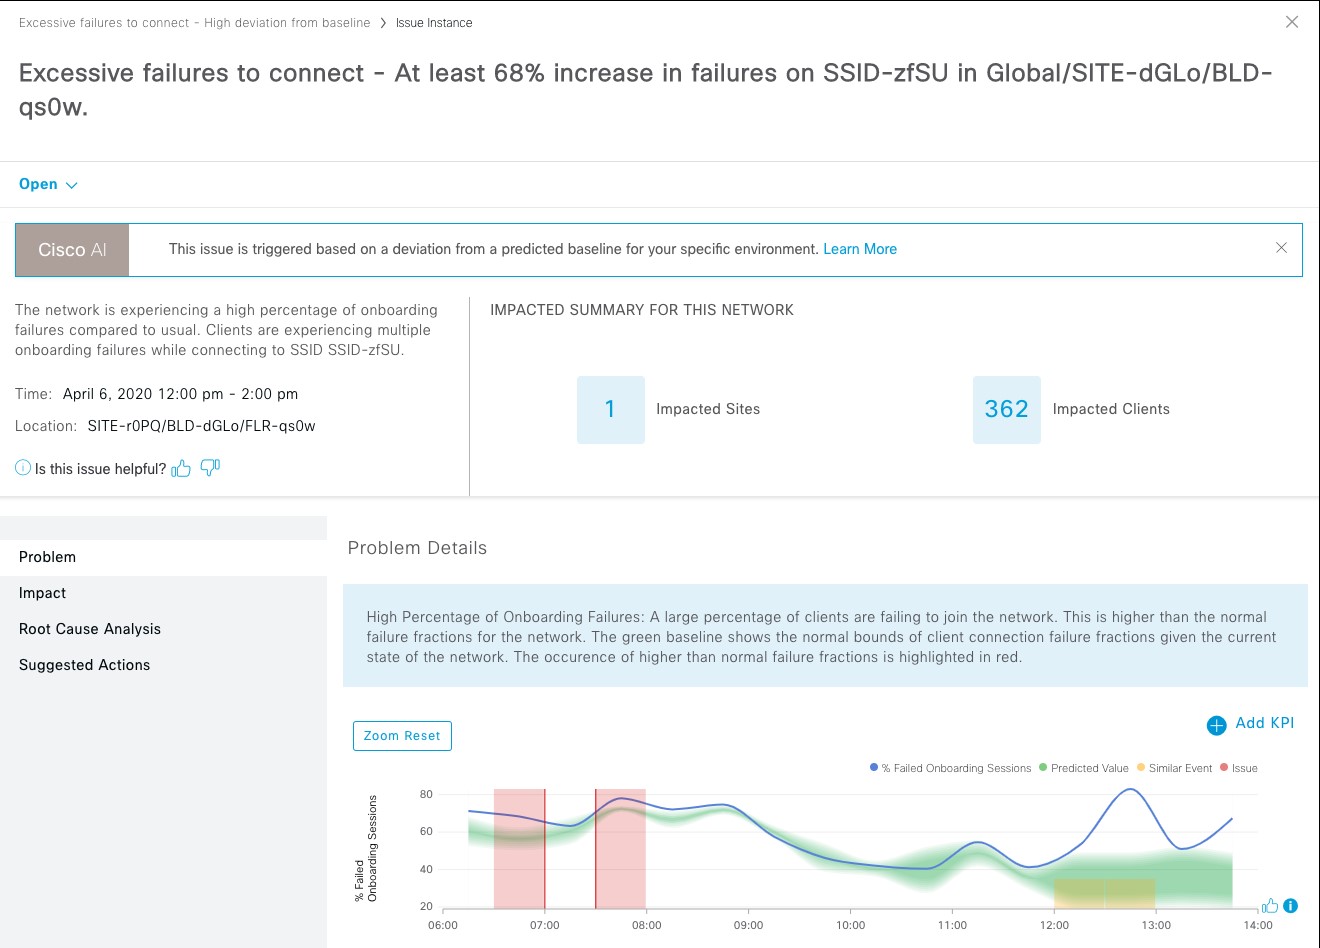
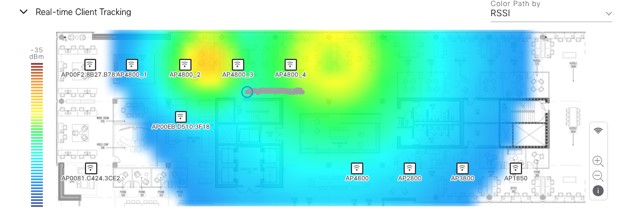
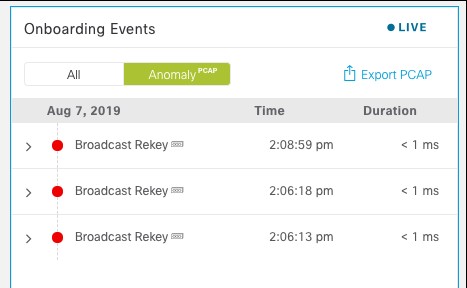
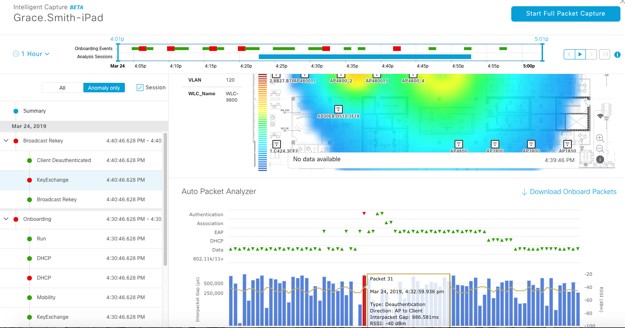
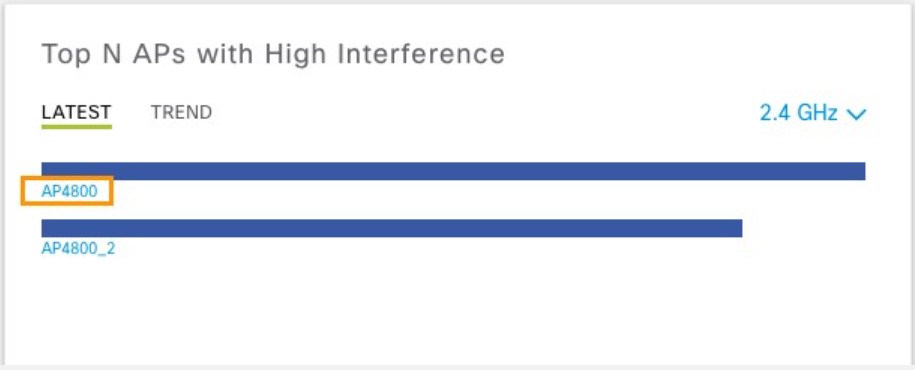
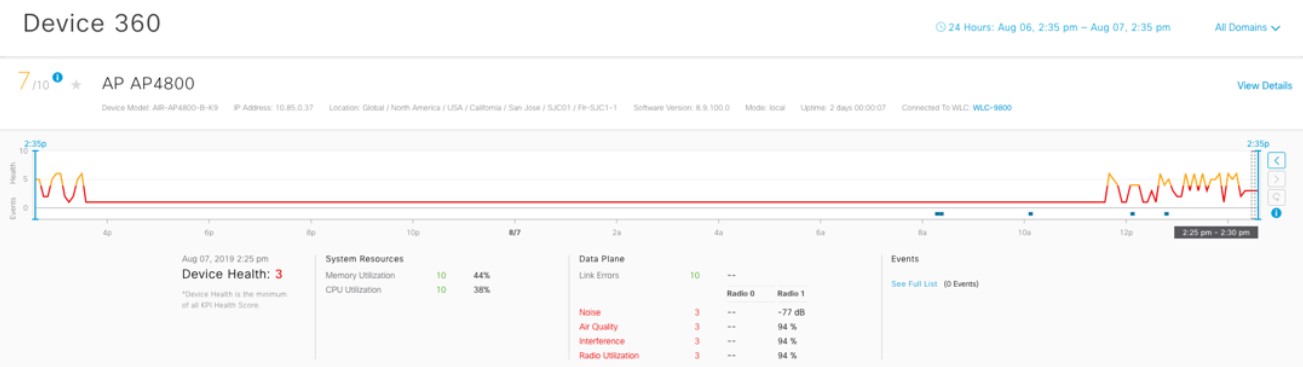
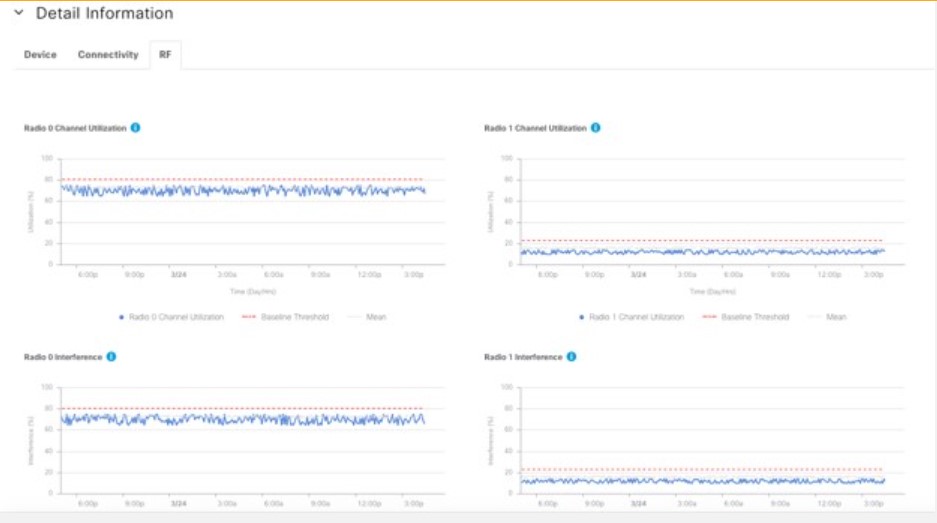
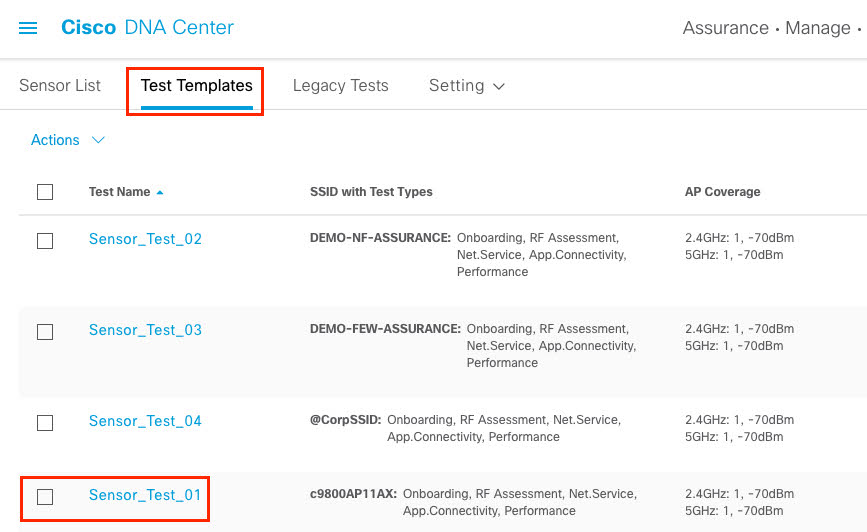
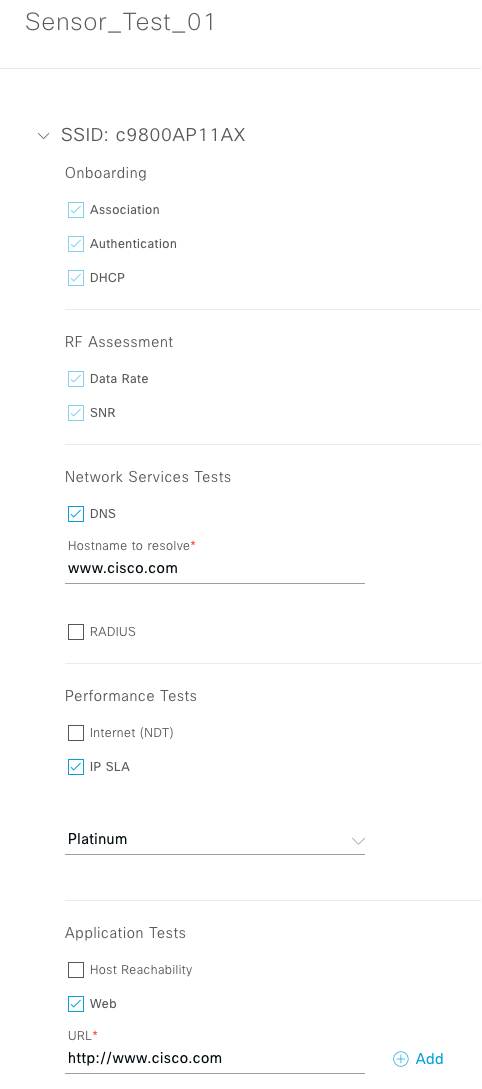
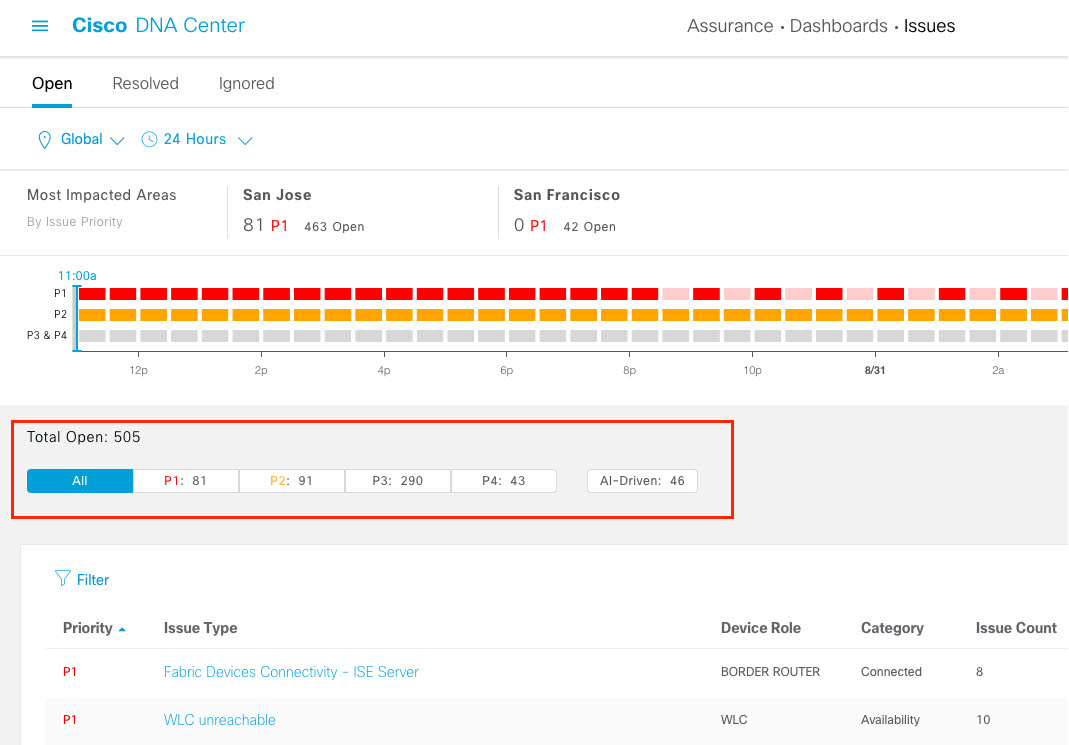
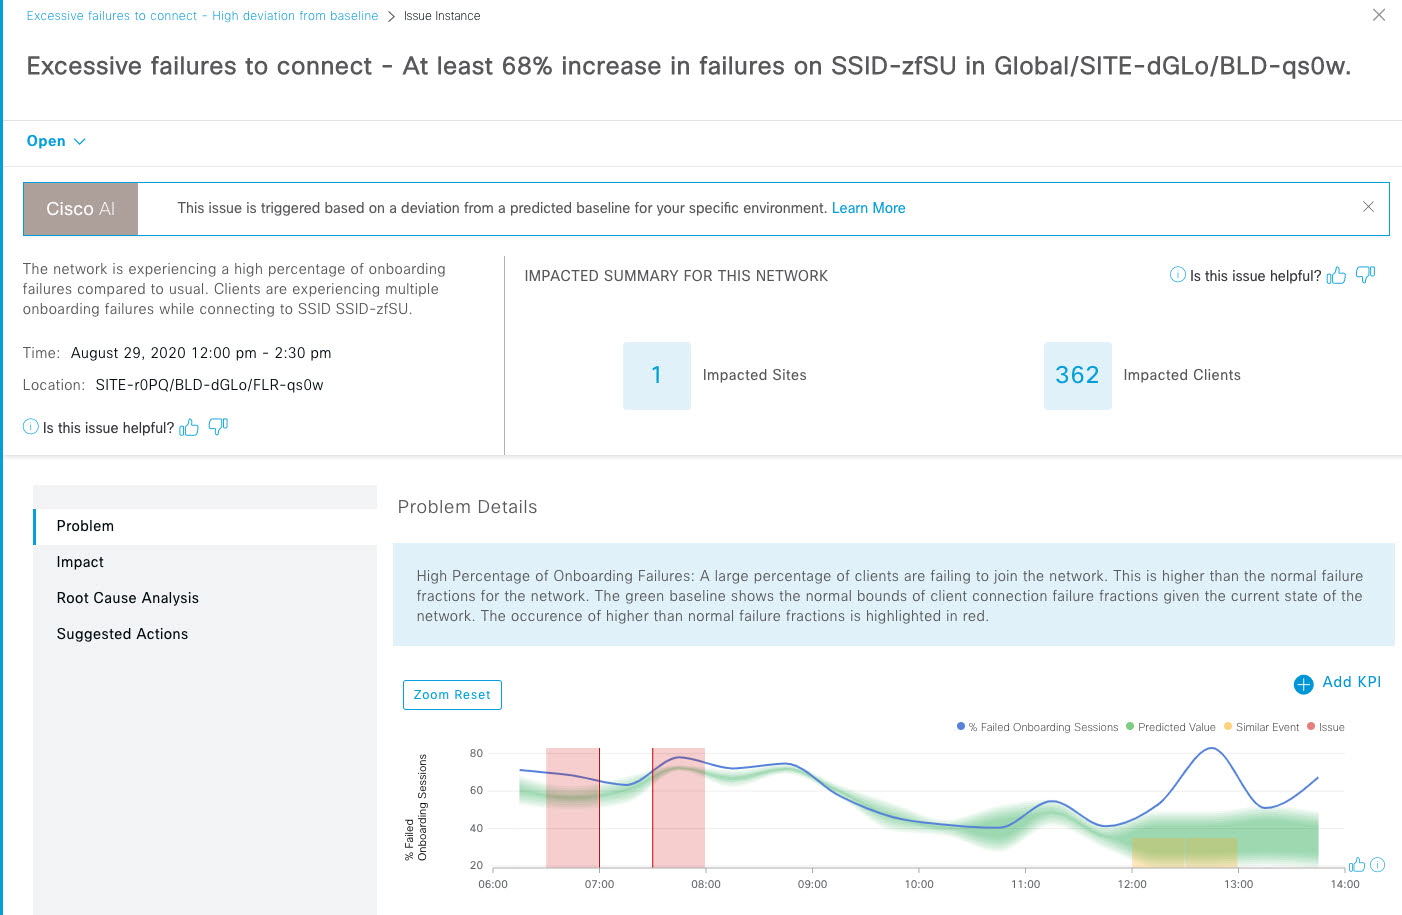
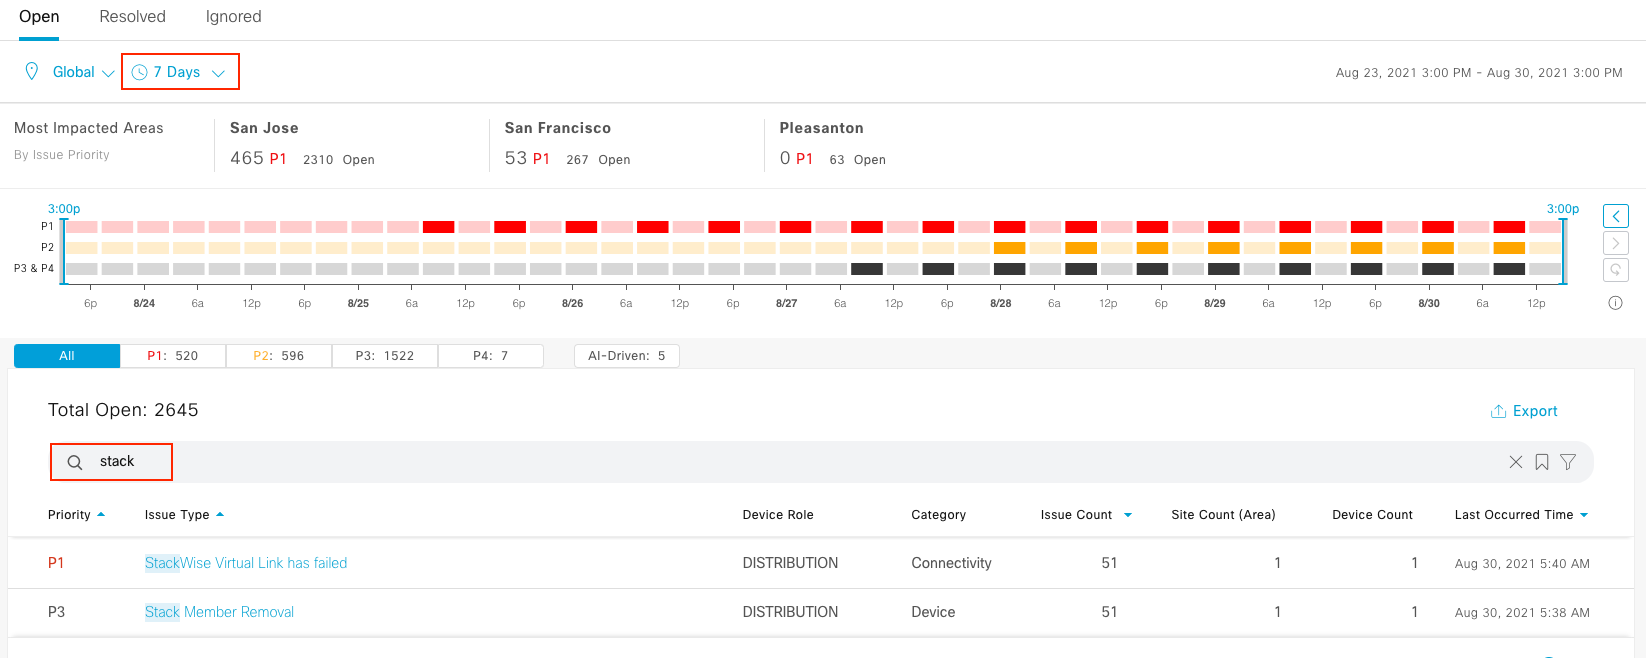
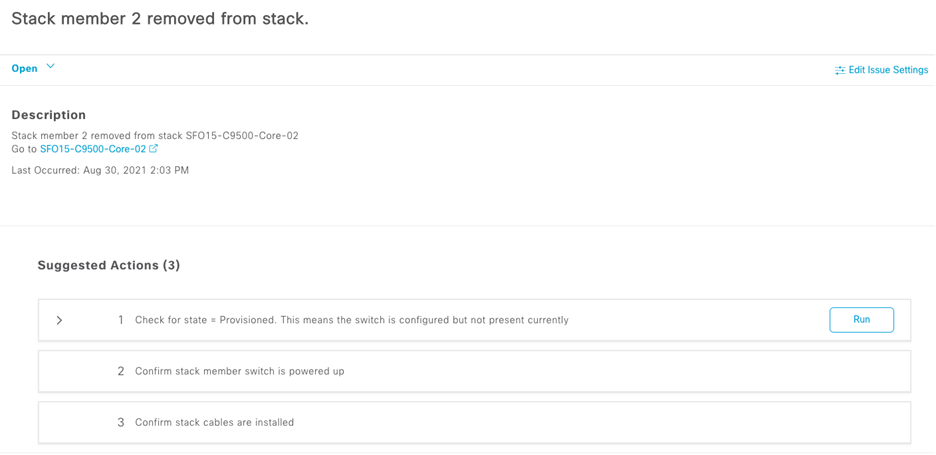
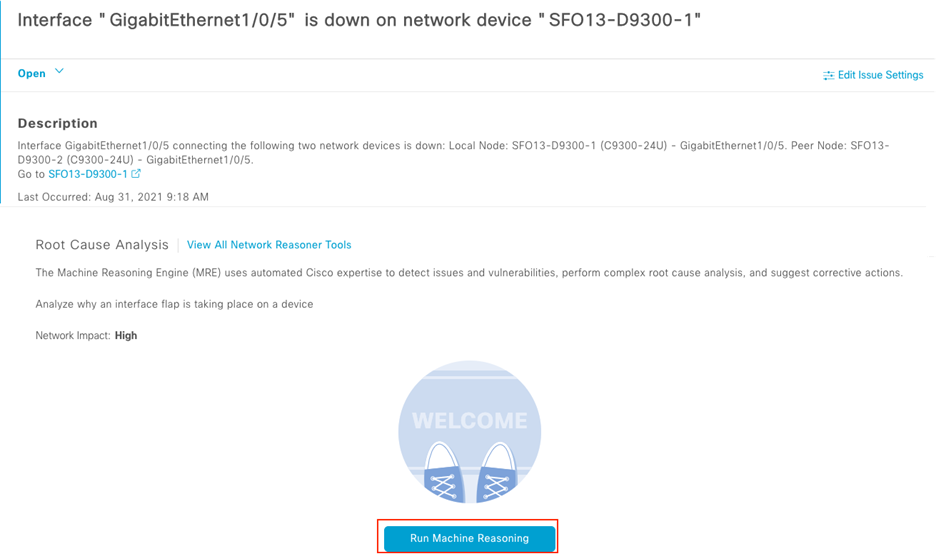
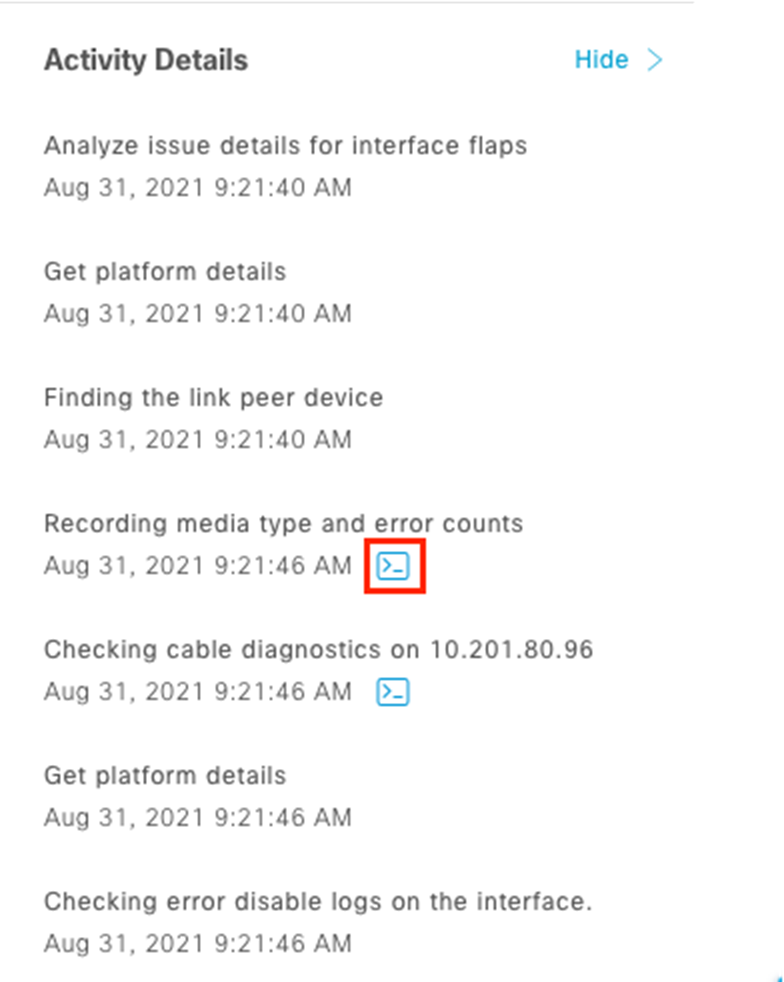
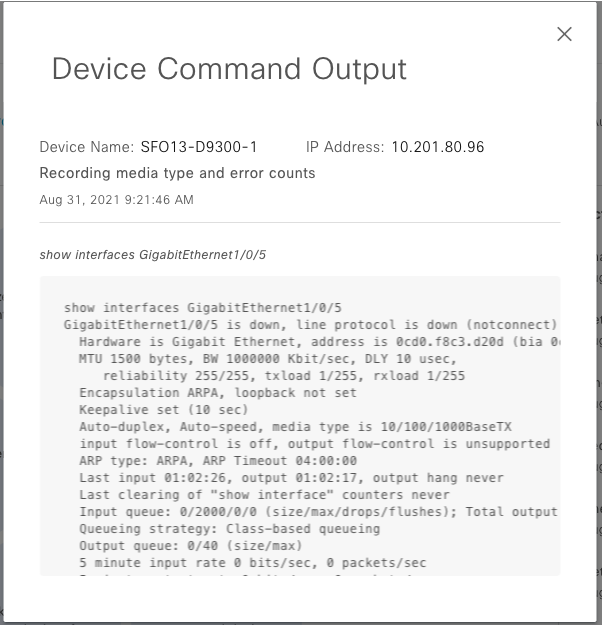
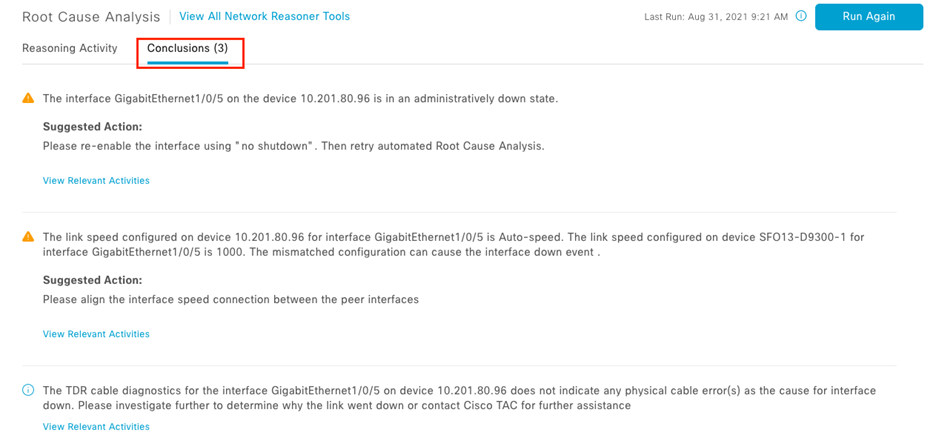
    • Assure network performance with real-time and historical data analytics, to provide actionable insights and detect problems before they happen along with Guided remediation actions for 100+ Insights

    • Design and Deploy Software-Defined Access (SD-Access) to simplifies delivery of consistent, highly secure, identity-based policy for users and devices across wired and wireless networks

    This enables the network admin to have a simplified integrated user experience across the entire enterprise portfolio of products.

    Requirements

    Requirements

    Requirements

    The table below outlines the requirements for this preconfigured demonstration.

    Required

    Optional

    Laptop

    Chrome Browser in incognito mode

    Getting Started

    Getting Started

    Get Started

    Procedure


     1   

    Open the Chrome browser in Incognito mode.

    Incognito mode is required to ensure the web cache is empty.

     2   

    When you are connected to the instant demo server, log in with user name demo and password demo1234!.


    Scenarios

    Scenarios

    Scenario: Operational Insights

    Value Proposition: 

    This scenario demonstrates how to check the overall health of network devices, wired and wireless, the top 10 issues with guided remediation, and how to use ServiceNow integration.

    Overall Health of the Network Devices and Health Scores for Wired and Wireless Clients

    Procedure


     1   

    From the Chrome browser Incognito window, open the DNA Center, navigate to Assurance > Dashboards > Health > Overall.

    Note: From this page, you can see the health of the network devices and clients in your organization over a 24-hr period.

    Example:

     2   

    To view the Top 10 Issue Types based on their priority and occurrence, scroll down the page.

    Example:

    Important: Several P1 related issues are impacting multiple users or devices across multiple sites.
     3   

    Click one of the issues from the list. To view information about the issues of that type, in the pop out window, click an instance for the selected issue type.

    Example:

     4   

    Select one of the links in the Issue Instance list to view the suggested actions based on this specific issue.

     5   

    To troubleshoot and resolve the issue follow the guided remediation.

    Example:

    Note: The guided remediation provides suggested actions based on our internal TAC database. These actions represent what a TAC engineer would request if you were opening a service request with this specific issue.
     6   

    Click Run and scroll down to see the additional output.

    Example:


    AI Driven Data

    Procedure


     1   

    Navigate to Assurance > Dashboards > Issues > Open.

    Example:

    The dashlet indicates the most impacted areas as well as a list of open items by priority.
     2   

    Click the AI-Driven link to view issues that were identified by deviations from predicted baselines.

    Example:

    AI items are identified by the AI indicator for the issue.

     3   

    Click the issue to see more details.

    Example:

     4   

    Click the link to view the AI information.

    Example:

     5   

    Close the pop out window.


    ServiceNow Integration

    Note: 

    Value Proposition: Now imagine if you were a level 1 operations engineer, and part of your responsibility was to provide ticket generation and resolution for issues impacting devices and users in your organization. Since we have integrated Cisco DNA Center with ServiceNow, the issues that were shown above in the top 10 issues section have auto generated tickets in ServiceNow.

    Procedure


     1   

    Open a new Chrome Incognito browser tab and copy and paste dcloud-dnac-ctf-inst-rtp.cisco.com/servicenow/.

     2   

    Click a ticket in ServiceNow that was generated by Cisco DNA Center.


     3   

    To perform root cause analysis, click on the first issue and click the link that would cross-launch the specific Cisco DNA Center Assurance page.

     4   

    Log in as prompted.

    Note: 

    We can also see all the details for the impacted device or client, along with the suggested actions for the guided remediation.


     5   

    From the 360 view, navigate to select one of the Onboarding issues in the Issues list.

    Example:


    From the pop-out window you can see the issue description as well as a list of suggested actions.


     6   

    Close the Service Now window and return to the DNAC main browser window.

    Value Proposition: 

    This allows us to quickly resolve user or device issues.


    Scenario: Client Health

    Value Proposition: 

    It is 10am and there have been a couple of users opening tickets stating they cannot get connected to the wireless network. You need to quickly understand the overall health of all the wireless clients across the organization.

    Overall Client Health

    Procedure


     1   

    Navigate to Assurance > Dashboard > Health > Client Health.

    • We can see the overall health of all wired and wireless clients, and the timeframe can be adjusted either forward or back in time, if necessary.

    • At the top of the screen, we can see a Sankey chart that shows how many total clients are in the environment, which clients are having issues, and an indicator of what the issue is related to.

    Note: 

    In the middle of the page you can see additional information related to RF statistics. Each of these can be viewed as a trend or with additional detail.

     2   

    Scroll to the charts in the middle of the page.

    Example:

    Note: 

    At the bottom of the overall client page, you can see the individual clients and their status, connected or not connected. You can also filter based on wired, wireless and/or their health score.

     3   

    Scroll to the table at the bottom of the page.

    Example:

     4   

    Scroll back to the top. In the Wireless Clients section, click View Details.

     5   

    To understand the clients impacted, click Authentication.

    Note: From here, click on an individual client to view the client 360 page, but we’ll examine that later.
     6   

    Close the pop out window.


    Client 360

    Note: This section works best with a fresh browser. If you have practiced the scenario previously, please completely exit your browser application and open a new Chrome Incognito window for this section.
    Note: 

    Value Proposition: Grace Smith, a user, opened a ServiceNow ticket, stating that she was not able to access the wireless network through one of her devices. She didn't provide additional details of her issue. Traditional troubleshooting methods would require us to call Grace and gather additional details: the type of device she was using, the MAC and IP address of the device, the location, date and time the issue occurred, the SSID, and whether the issue arose in a specific application or a network connectivity issue.

    Let’s look how quickly we can answer these questions using client 360.

    Procedure


     1   

    Navigate to the search engine icon in the top right corner and type Grace.

    Example:

     2   

    Click Grace.Smith and then click User 360.

    Example:

    Note: 

    Value Proposition: We can see her iPhone had some red indicators at times when her device was having issues. We can adjust the sliding window to that specific timeframe. As we scroll across the graph, we can see several pieces of important information: the device type, MAC Address, IP Address, Location, VLAN ID, RSSI, SNR, Tx/Rx, SSID, AP, Channel, and Band. This is all the information we would have needed to gather from Grace without the client 360.

    Note: From the client 360 page, we can see all the devices Grace has on the network.
     3   

    Scroll to the Event Viewer section to see a Broadcast Rekey issue.

     4   

    In the Event Viewer, expand the Broadcast Rekey and click Key Exchange.

    Note: This event viewer represents what we would see from the WLC CLI by entering debug client mac-address aaaa.bbbb.cccc in the wireless controller; however, the event viewer provides a much simpler way to visualize this information.
     5   

    Click the down arrow next to Event finder and scroll back up to Issues.

     6   

    Highlight the Issues for this client based on the timeframe selected.

    Note: The onboarding information shows the SSID and network devices in the path, along with their associated health scores.
     7   

    Expand the Onboarding section.

     8   

    Expand the Application Experience section.

    Note: We can see the applications Grace was using at the time and their associated health scores.
     9   

    Under Detail Information, click the iOS Analytics tab.

    Note: At the bottom we see additional data regarding device details, connectivity and RF statistics, but more importantly the iOS analytics which provides a view of how the client sees the access point and the related disassociation reason codes. We are obtaining this information from the Cisco Apple partnership.
     10   

    Click through the Device Info, Connectivity, and RF tabs.

     11   

    Select the User Defined Network tab to view details about Grace's UDN, including the status of each device included in the UDN.

    Example:


    Intelligent Capture

    Use Intelligent Capture to examine the packet exchange between the AP and client, and to identify the root cause of key exchange issues.

    Procedure


     1   

    Scroll to the top of the page and select Intelligent Capture.

    Example:

    Note: We can use Intelligent Capture to visualize the roaming path of the client on a heat map. Along with the associated RF statistics for the timeframe specified above.
     2   

    To see all the anomalies for this client, click Anomaly.

     3   

    Expand the Broadcast Rekey issue and click KeyExchange.

    • When you click on the KeyExchange issue, the Auto Packet Analyzer will show the packet exchange between the client and access point. The triangles represent the packet direction. A triangle facing up is from the client to the AP, and a triangle facing down is from the AP to the client.

    • We can see from this packet analyzer that the client did not respond to an EAP challenge from the AP, therefore based on EAP timeout parameters the AP sent a Deauthentication frame to the client.

     4   

    To see additional details about the packet, scroll over the red bar on the bottom graph.


    Scenario: Device Health

    Value Proposition: 

    We think the EAP issue outlined in Use Case 2 could be related to poor RF conditions for the access point Grace was connected to at that time, but we need to confirm this hypothesis.

    Spectrum Analysis

    Procedure


     1   

    Navigate to Assurance > Dashboards > Health > Network Health.

    We can use Network Health to see the overall health of the network devices in our environment.

    Note: 

    We can also see the health scores of each network device in a list view at the bottom. We know Grace was connected to the 4800 Access Point based on the client 360 information.

     2   

    Click on AP4800 from the Top N APs with High Interference dashboard. This launches the device 360 screen.

    The device 360 window is displayed.

     3   

    Similar to the client 360, as we scroll across the graph for the given timeline, we can see some important details for the access point.

    Note: 

    We can see the Noise, Air Quality Index, Interference, and Radio Utilization. From here, we can quickly see that the radio was experiencing interference.

    Note: 

    We can further confirm this by looking at the RF tab at the bottom of the page.

     4   

    Click the RF link under the chart.

    Note: 

    RF details confirm the Radio 0 interference level was well above normal.

     5   

    To understand what was causing the interference, use the Intelligent Capture view.

     6   

    Scroll to the top of the page and click Intelligent Capture.

    Note: 

    This view provides additional details regarding the channel utilization, frame count and frame errors. Understanding the management vs data frame count, the amount of Tx/Rx errors and noise floor is critical in a wireless environment as these will directly impact the clients throughput and performance.

     7   

    Click on the Spectrum Analysis tab.

     8   

    Click Start Spectrum Analysis.

    You will see the spectrum analysis data along with the interference source below.

     9   

    Click Stop Spectrum Analysis.

    1. Click X to close the window.

     10   

    Navigate to Assurance > PoE.

    Note: 

    PoE Telemetry is available on Cisco 9300, 9300/L, 9400, and 3850 platforms with IOS-XE 1.12.3s and 17.3 software versions. To enable a PoE subscription on these platforms, ensure that the Netconf port is enabled when you discover these devices.

     11   

    Click View Details on each dashlet to see additional information about PoE devices in your network.

    Example:

     12   

    Click View Details for the PoE Operational State Distribution dashlet.

    Example:

     13   

    Select the Power Denied section of the graphic and then select the 9300 series switch that should be powering an IP phone.

    Example:

     14   

    From the Device 360 window, scroll down to the PoE section to view additional PoE information for the select switch.

    Example:

     15   

    In the search field, enter stack and then select Device 360 for the SJC01-Stack-01 device.

    New to DNA Center 2.1 is a StackWise dashlet for stacked switches.

     16   

    Click the link for StackWise to open that section.

    Example:

    The StackWise tab lists each member of the stack along with its role priority and port information.

    Example:

     17   

    Now, let's look at StackWise information for a virtual switch. Search for C9500. Click Device 360 for the SFO15-C9500-Core-01 device.

    Example:


     18   

    Scroll down to the Detailed Information section and click the StackWise Virtual tab.

    Example:


     19   

    Click the Interfaces tab and then click SVL to see the status of the virtual links.

    Example:


    Scenario: Application Health

    Value Proposition: 

    Grace has opened another ticket regarding issues with Microsoft Office 365. We need to get a quickly understand if this is impacting multiple users and what’s contributing to the application related issues.

    Application Statistics

    Procedure


     1   

    Navigate to Assurance > Dashboards > Health > Application Health.

    Note: 

    From this screen, we can see all the applications in use on the network along with their associated health scores.

    View the list view and the health score for each application at the bottom.

     2   

    For Type select All, and then click Apply.

    Example:

    Note: 

    We can see the ms-office-365 application has a health score of 2.

     3   

    Click ms-office-365.

    Example:

     4   

    Under Exporters, click the down arrow next to the device listed. Note the details regarding usage, throughput, packet loss, jitter and latency.

    Example:

    Note: 

    We can see from the information there are two users being impacted, Grace and Gordon.


    Scenario: Sensors

    Value Proposition: 

    The network operations manager has informed you the CIO and several senior executives will be meeting in the board room for the next couple days. He wants to make sure the wireless environment in that area is performing as expected, and if there are any reported issues he needs to quickly prove that wireless is not the problem. You’ve deployed several 1800s sensors in the area to proactively perform testing of the RF environment from a client’s perspective.

    Sensor Driven Test Capabilities

    Procedure


     1   

    Navigate to Assurance > Manage > Sensors.

     2   

    Click the Test Templates tab.

     3   

    Click Sensor_Test_01 for one of the sensors in the list.

     4   

    Click Edit for the Tests section.

     5   

    Highlight the different testing capabilities of the sensor.

     6   

    Click Cancel twice.


    Overall Sensor Health

    Procedure


     1   

    To access the wireless sensors, navigate to Assurance > Dashboards > Sensors.

     2   

    Highlight the overall sensor health, with the capabilities to understand how sensors are performing at each location for each test type.

     3   

    Click the links for the various tests under the Overall Summary section to see more detailed results.

     4   

    Use the Latest and Trend tabs at the bottom to get a visual summary of the test results by sensor, site, or test type.


    Scenario: Issues Dashboard

    The network issues listed in the Issues dashboard fall under the following categories:

    Threshold-based issues

    Issues detected by Assurance

    AI-Driven Issues

    Issues detected by Cisco AI Network Analytics. These issues are triggered based on deviations from the predicted baseline for your specific network environment.

    Layer 2 Loop Issue

    Root cause analysis done by the Machine Reasoning Engine (MRE).

    Procedure


     1   

    Go to Assurance > Dashboards > Issues.

    The default view includes all open issues. You can filter the issues by selecting the priority (P1-P4), or by selecting AI-Driven.

    Example:

    Selecting an issue from the list opens details about the issue and suggests actions to determine the case and resolution for the issue.

     2   

    Select the AI-Driven tab.

     3   

    Select one of the AI-Driven issues.

    Example:

    Note that the AI-Driven issues include a baseline overlay on a predicted value graphic. Deviations between these lines triggers the AI-Driven issue alert.

     4   

    Scroll through the Problem, Impact, Root Cause Analysis, and Suggested Action links.

     5   

    Change the focus to All issues by toggling the AI-Driven button off.

    Example:


     6   

    Change the time period to 7 Days and search issues for stack.

    Example:


    There are two issues. One issue is for a physical switch, and the other issue is for a virtual switch.

     7   

    Click Stack Member Removal.

     8   

    Click the issue and see details and suggested actions. Click Run to see the output from the suggested command.

    Example:


     9   

    Click the X to close the details window. Click StackWise Virtual Link has failed.

    Note the screens for the virtual switch include relevant information for the virtual form factor.

     10   

    Click through the Problem Details and Suggested Actions.

    Example:


     11   

    Click the X in the upper right corner to close the pop out window.

    Another feature of DNA Center related to issue resolution is the Machine Reasoning Engine (MRE). MRE uses automated Cisco expertise to detect issues and vulnerabilities, perform complex root cause analysis, and suggest corrective actions.

     12   

    Clear your search parameters and change the time period to 24 Hours. Click the first issue in the list.

    Example:


     13   

    Click the first instance of the issue.

    Example:


    Note the description of the issue and the availability to use MRE for root cause analysis.

     14   

    Click Run Machine Reasoning.

    Example:


    The MRE runs a series of tests and commands to determine possible root cause.

     15   

    Click View Activity Details to see the results of these tests and commands.

    Example:


     16   

    The details include each action and result. You can click the icon next to one of the steps to see the actual CLI output for the command issued.

    Example:


    In this example we see that the show interfaces command was used to view the state of the faulty interface.


     17   

    Click the Conclusions tab to see suggested resolution to the issue.

    Example:


    Each conclusion includes a suggested action. In this way much of the troubleshooting has been automated.

    MRE is currently able to detect and suggest actions for the following issue types:

    • High CPU utilization

    • Power supply failures

    • Interface down

    • STP loop detection

    • Wired client authentication failures

    • DHCP reachability failures


    Scenario: Rogue and aWIPS Dashboard

    Use the Rogue and aWIPS dashboard to get a detailed threat analysis and global view of all rogue APs and aWIPS signatures detected in the network. The Rogue and aWIPS dashboard also provides insight into the highest-priority threats so that you can quickly identify them. The Rogue Management application uses streaming telemetry to retrieve data on rogue APs.

    Procedure


     1   

    Go to Assurance > Dashboards > Rogue and aWIPS.

    Example:

    The Active High Threats and High Threats Over Time graphs display information about rogue APs detected in the last 3 hours by default. The graph information is based on the time interval that you choose from the hours drop-down list.

    The Active High Threats widget presents information about threat levels in the form of a donut graph.

     2   

    Hover over the group to view the number of rogue APs found in each threat level.

    The High Threats Over Time graph presents information about high threats over time based on the time interval that you choose from the drop-down list.

     3   

    Hover over the graph to view the number of high threats that occurred at a particular time.

     4   

    Scroll down to the Threats table.

    Example:

    The Threats table displays a list of rogue APs found on the network. The following information is displayed for each rogue AP found on the network:

    Information Explanation
    ID Rogue AP identifier
    Threat Level Color-coded classified threat level
    Threat MAC Address MAC address of the rogue AP
    Type Threat types for rogue AP and aWIPS
    Detecting AP Name of the AP that is currently detecting the rogue AP. If multiple APs detect the rogue, the detecting AP with the highest signal strength is displayed.
    RSSI RSSI value reported by the detecting AP
    SSID Service Set Identifier that the rogue AP is broadcasting.
    Clients Number of rogue clients associated to the access point
    Last Reported Date, month, year, and time when the rogue AP was last reported
     5   

    To launch the Threat 360° view for a particular AP, click the rogue AP row of interest in the Threats table.

    The Threat 360° pane is displayed.

     6   

    Click the X in the upper right corner to close the 360-degree view.


    Scenario: Wi-Fi 6 Dashboard

    The Cisco DNA Center Assurance Wi-Fi 6 Dashboard provides a visual representation of your wireless network. The dashboard contains various dashlets which display the Wi-FI 6 Readiness, and the efficiency of the Wi-Fi 6 networks compared to non-Wi-Fi 6 networks.

    Procedure


     1   

    Navigate to Assurance > Dashboards > Wi-Fi 6.

     2   

    Select the Client Distribution by Capability dashlet.

    Example:

    This dashlet shows all clients associated and their capability in the wireless network. The inner circle displays the wireless protocol capabilities of all the different clients in the network. Capability here is the ability of wireless clients to associate with Wi-Fi 6 APs or non-Wi-Fi 6 APs. The outer arc segment shows how many 802.11ax capable client are joined to a Wi-Fi 6 network as well as how many of them are not.

     3   

    Select Wi-Fi 6 Network Readiness dashlet.

    Example:

    This dashlet shows all the APs in the network. The inner circle shows the APs which are Wi-Fi 6 APs and non-Wi-Fi 6 APs. The outer arc segment shows the number of Wi-Fi 6 enabled AP in the network.

     4   

    Select the AP Distribution by Protocol.

    Example:

    This dashlet shows the protocols enabled on your APs in real time.

     5   

    Select the Wireless Airtime Efficiency dashlet.

    Example:

    This dashlet compares and displays the Airtime Efficiency between your Wi-Fi 6 network and Non-Wi-Fi 6 network for each of the access categories (voice, video, best effort, background). The spectrum is efficiently utilized if the AP’s radios can send more traffic (successful bytes transmitted to the client) in less airtime (microseconds) than other networks under similar RF conditions.

     6   

    Select the Wireless Latency by Client Count dashlet.

    Example:

    This Dashlet compares the Wireless Latency between your Wi-Fi 6 and Non-Wi-Fi 6 Network for each of the access categories (voice, video, best effort, background). Wireless latency is measured by the time (microseconds) it takes for a packet to be successfully transmitted from an AP to the client. Hence, AP radios with a higher client count generally have higher latency than compared to those with a lower client count under similar RF conditions.


    Was this page useful ?
    Was this page useful ?
    Email*
    Enter Valid Email Address
    What can we do to improve your experience?
    Help us with more info.*


    *Required field
    Was this page useful ?
    Email*
    Enter Valid Email Address
    What did you like about it?
    *Required field
    The feedback has been submitted successfully!