About
This Solution
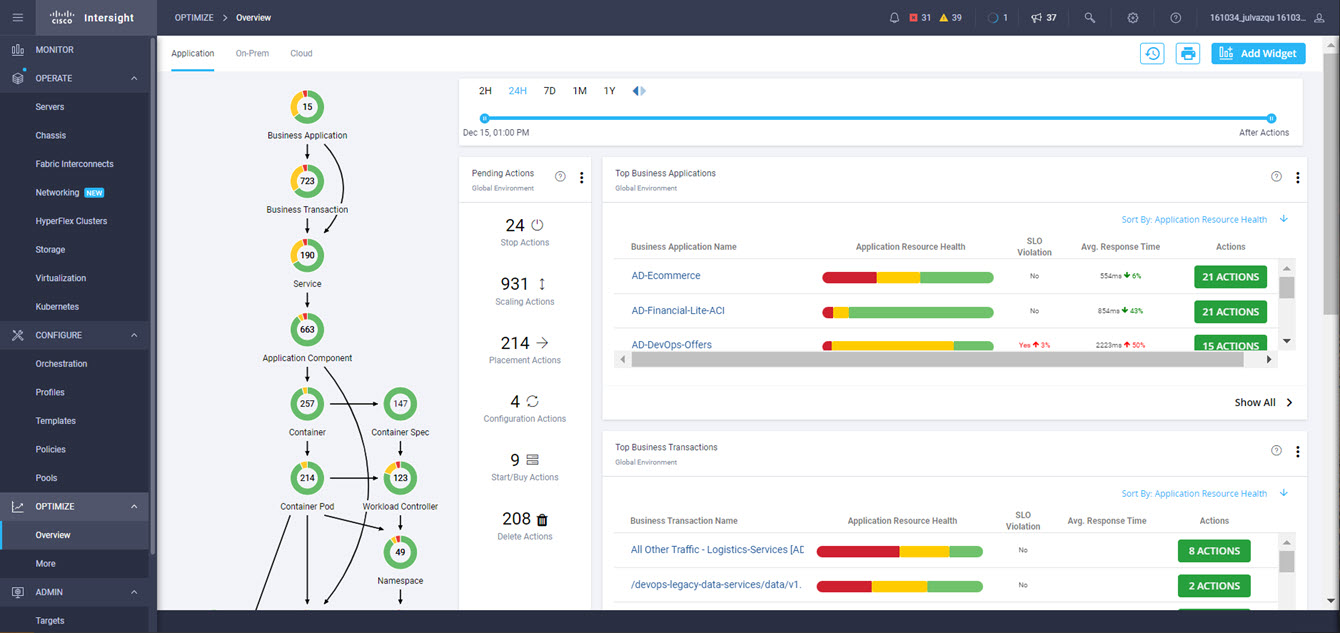
Cisco Intersight is a cloud operations platform that delivers intelligent visualization, optimization, and orchestration for applications and infrastructure across multi-cloud environments. Intersight offers a new paradigm that allows traditional infrastructures to be operated and maintained with the agility of cloud-native infrastructure. Conversely Intersight provides cloud-native environments with many of the proven stability and governance principles inherent to traditional infrastructure.
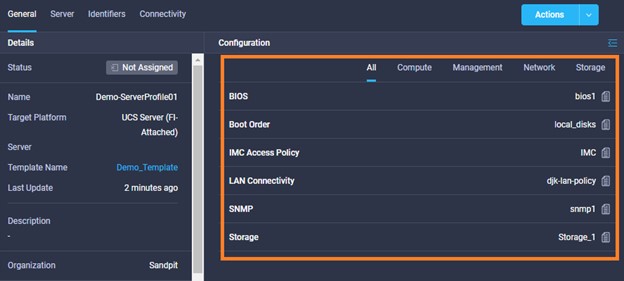
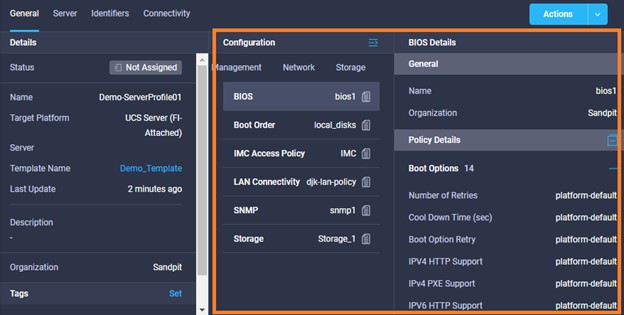
Cisco Intersight has deep integration with Cisco UCS and HyperFlex systems allowing for remote deployment, configuration, and ongoing maintenance. The model-based deployment works for a single system in a remote location or hundreds of systems in a data center and enables rapid, standardized configuration and deployment. It also streamlines maintaining those systems whether you are working with small or large configurations.
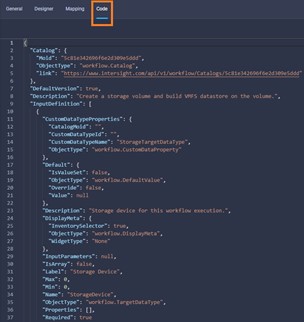
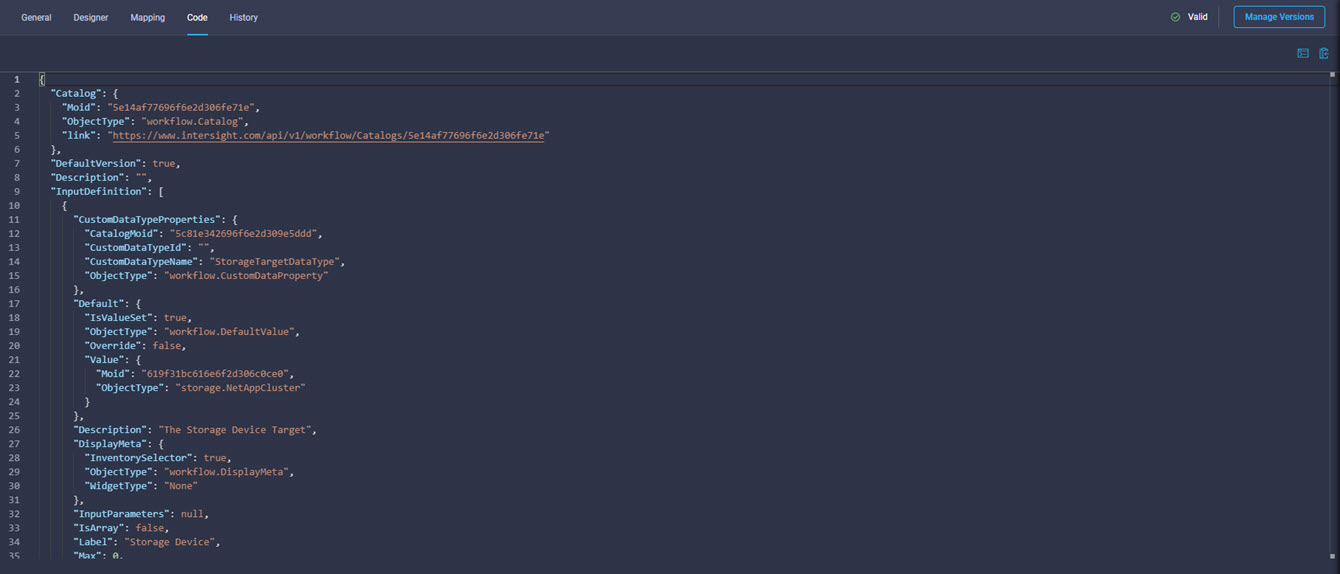
Cisco Intersight includes an API that supports the OpenAPI Specification, a powerful definition format to describe RESTful APIs. Support for the OpenAPI specification provides access to an interoperable REST API with tools that automate the generation of the Intersight API documentation (intersight.com/apidocs), API schemas, and SDKs. The Intersight API includes fully functional Python and PowerShell SDKs.
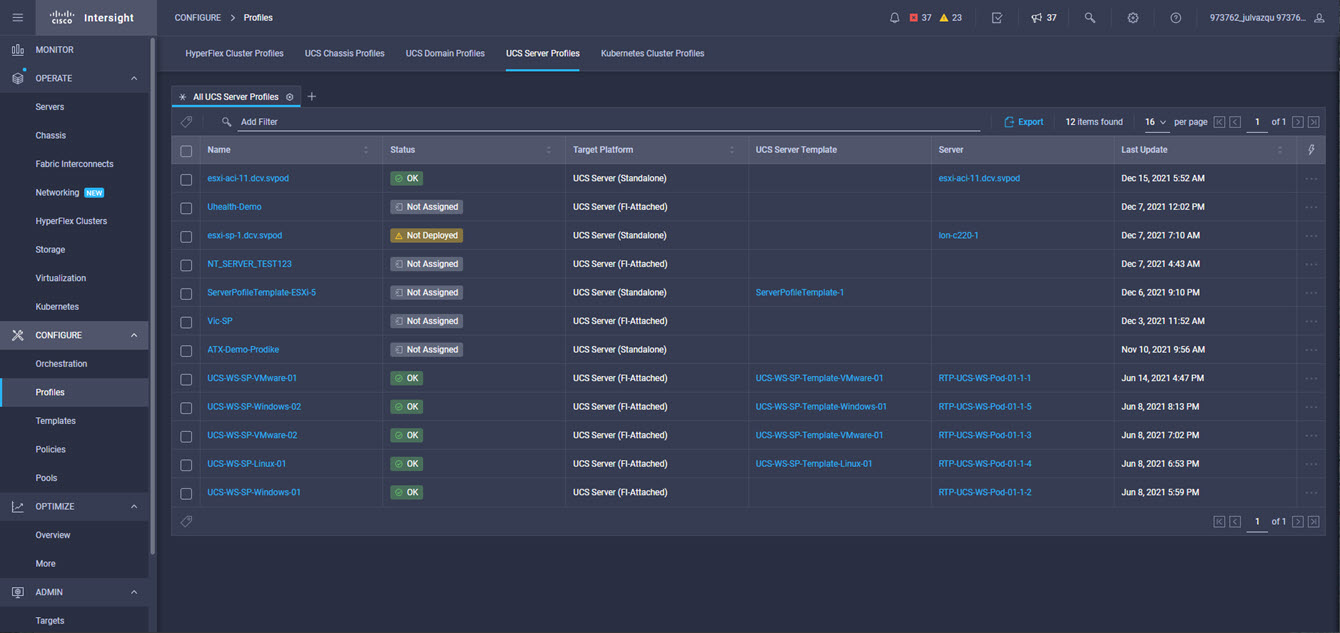
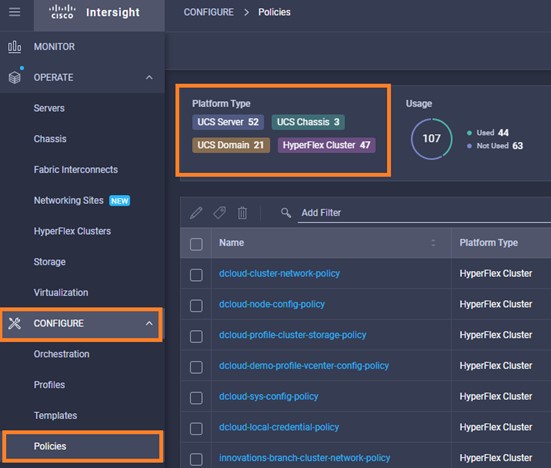
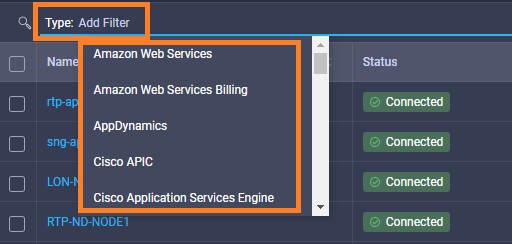
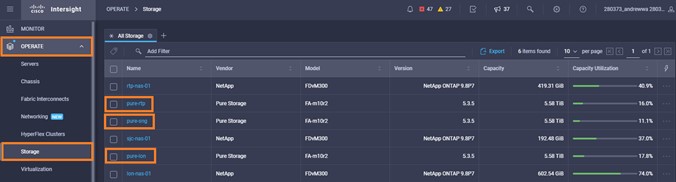
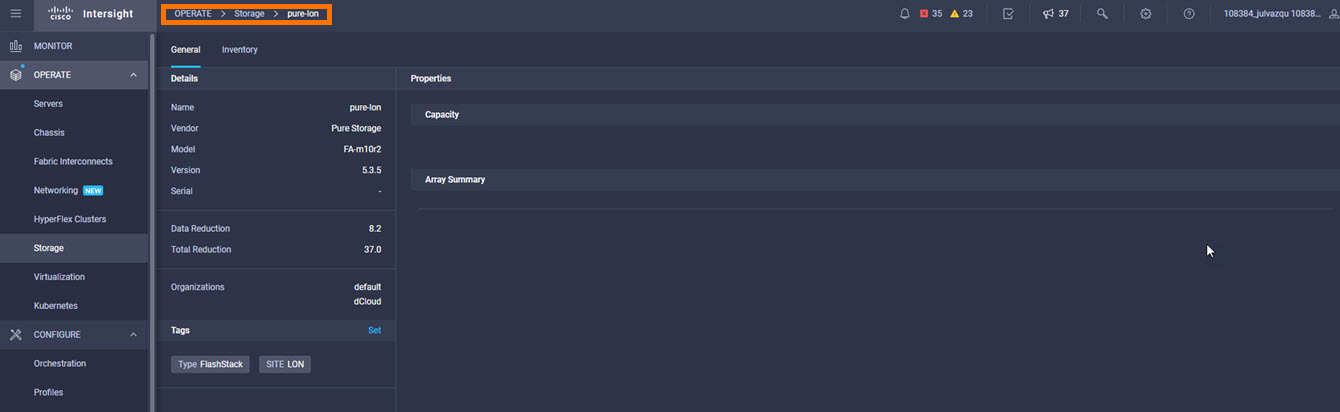
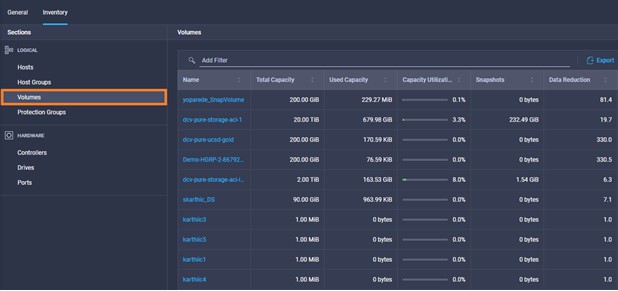
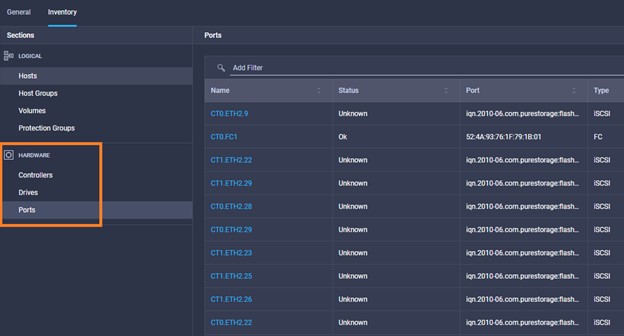
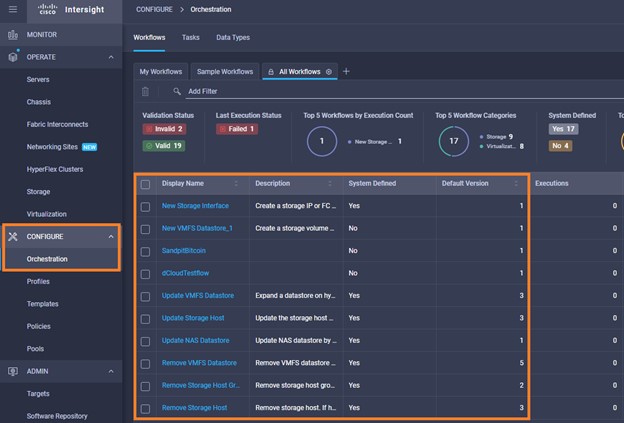
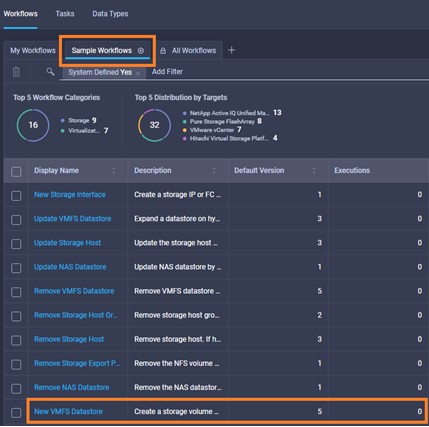
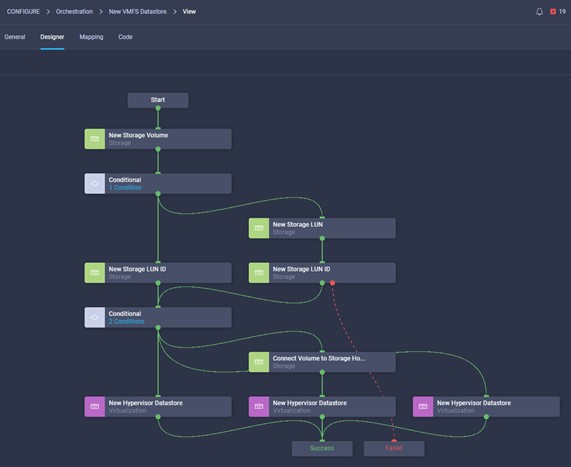
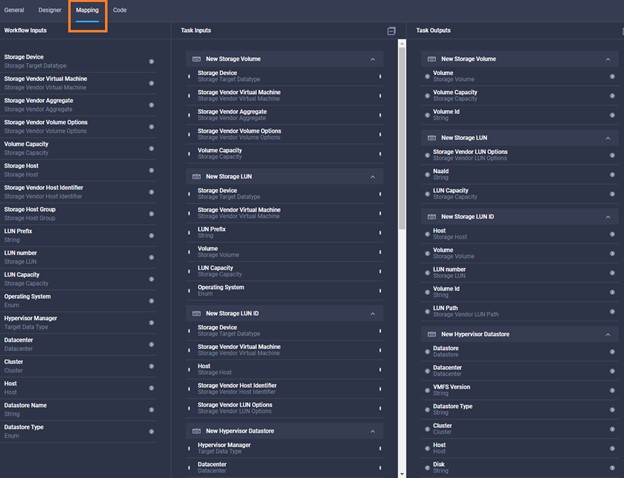
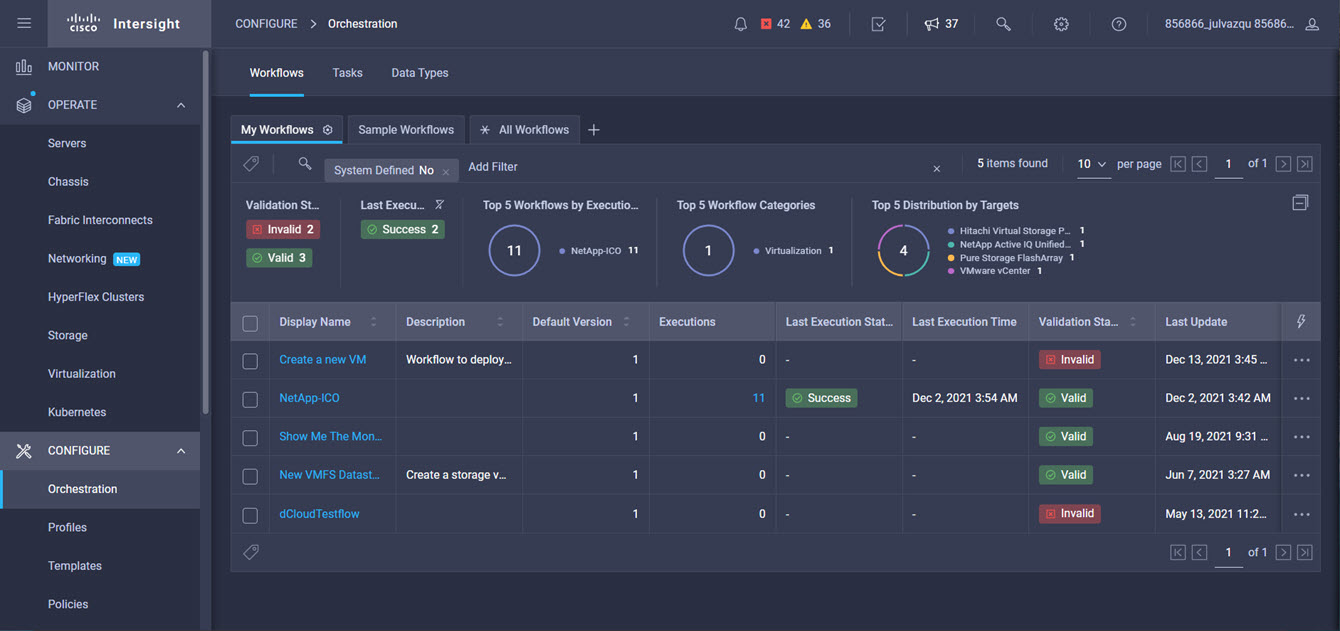
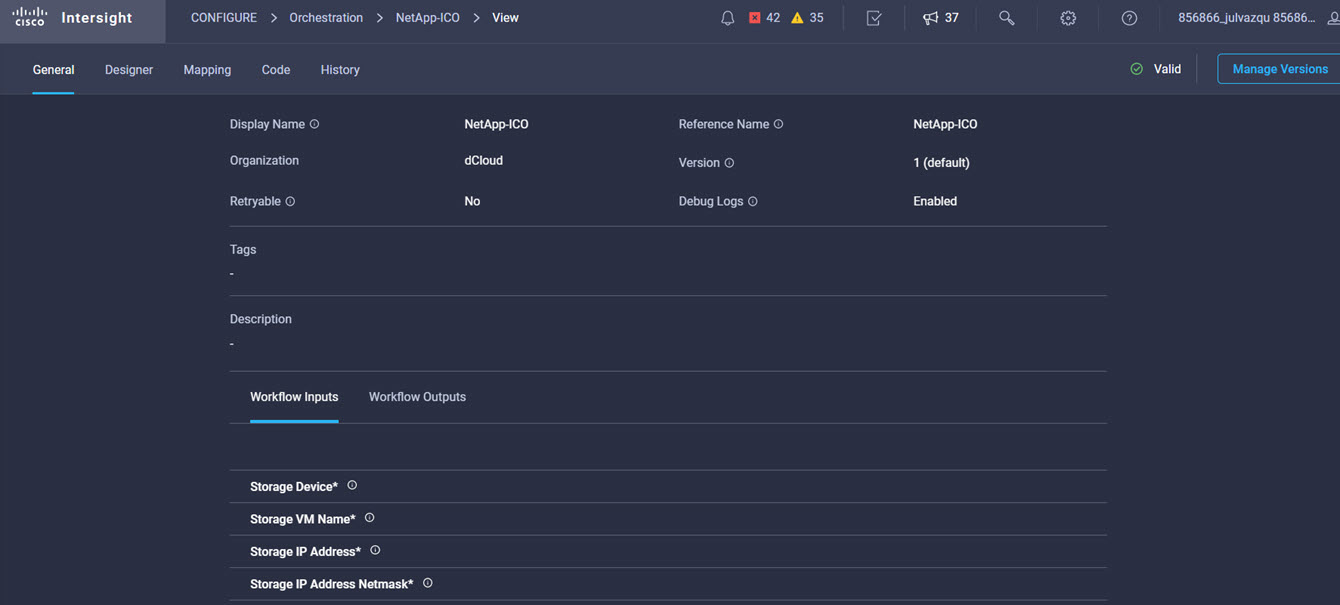
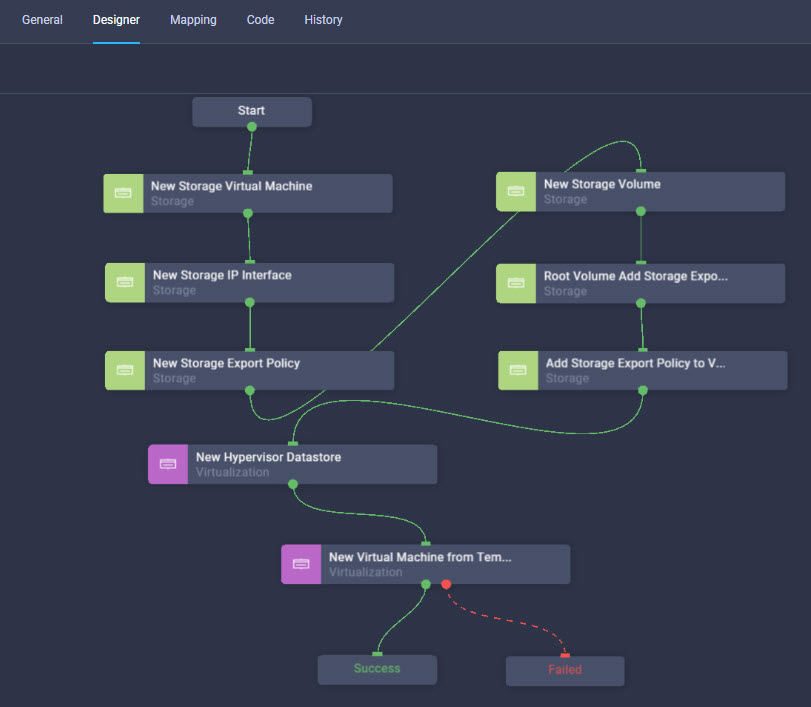
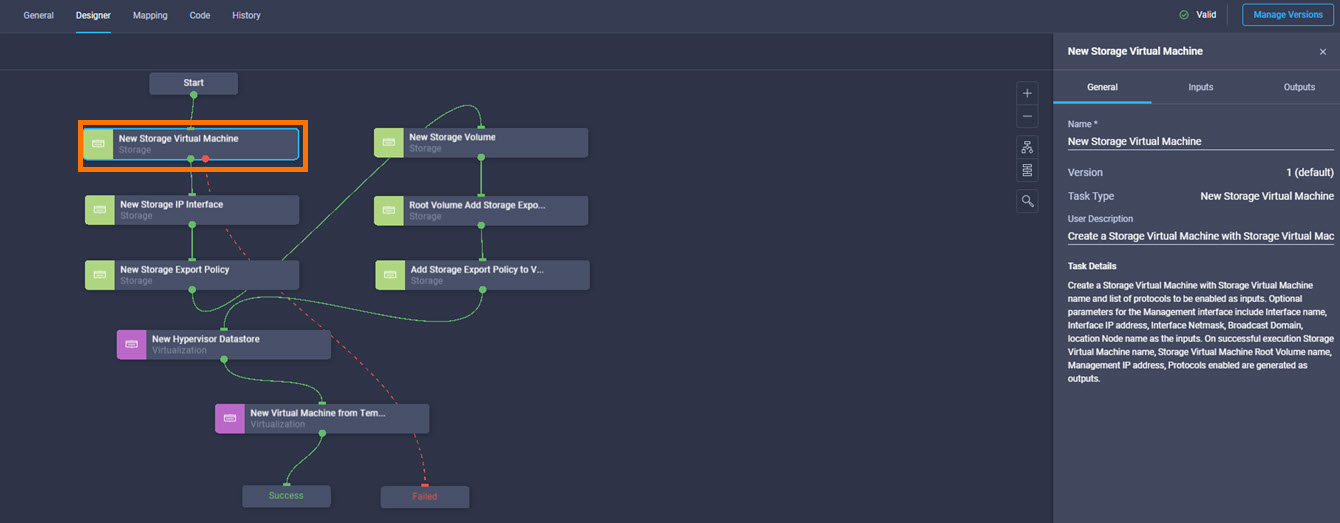
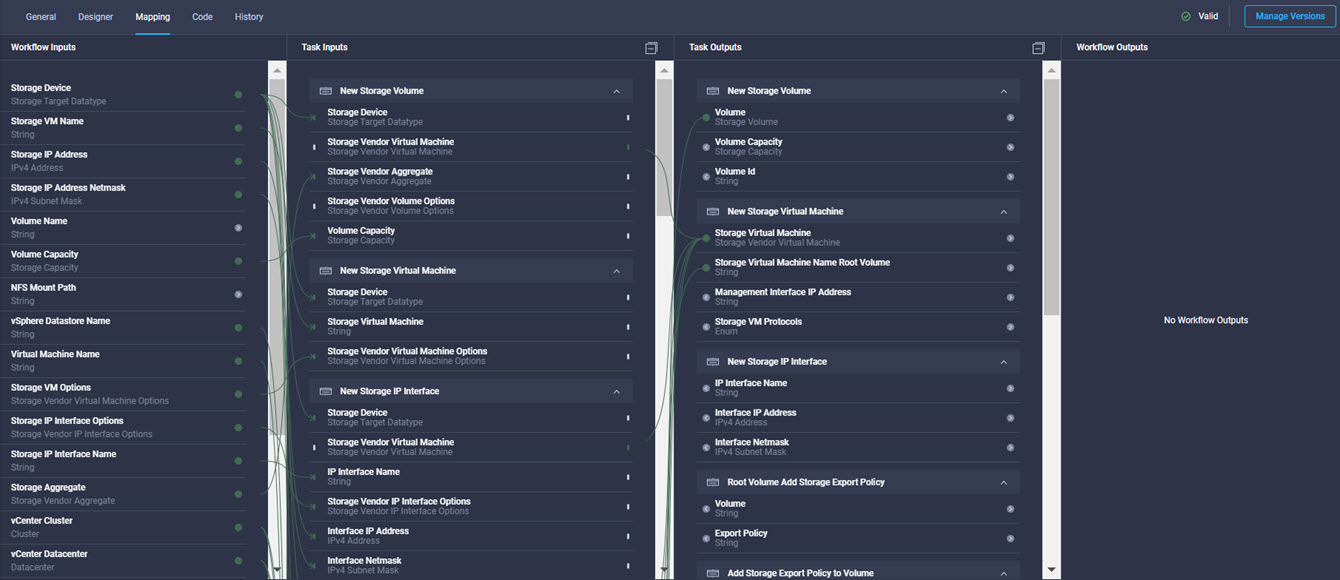
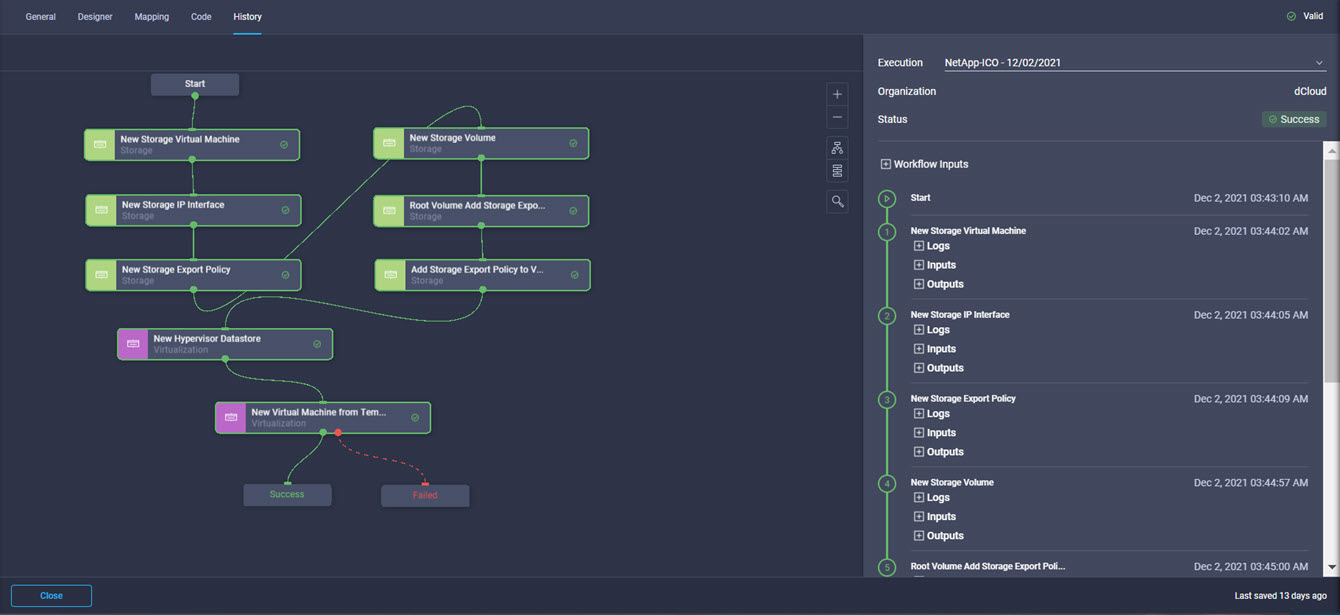
It is also possible to add other endpoint devices such as Pure Storage devices and VMware vCenter into Cisco Intersight via the deployment of Cisco Intersight Assist. You can then use the workflow designer to deploy/configure Pure Storage and VMware vSphere components. In this instant demonstration, you will have access to the dCloud Cisco Intersight account for a period of 2 hours. You will have access to review a selection of infrastructure we use to provide dCloud demonstrations, including Cisco UCS domains, HyperFlex clusters, Pure Storage and VMware vCenter systems.
In this instant demonstration, you will have access to the dCloud Cisco Intersight account for a period of 2 hours.
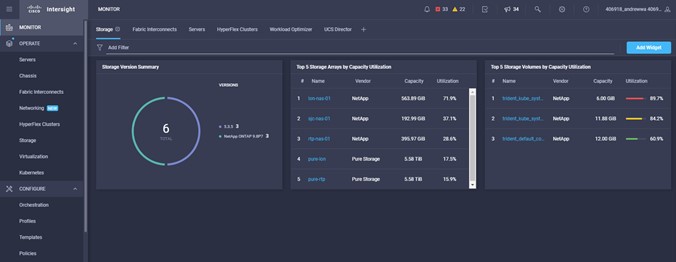
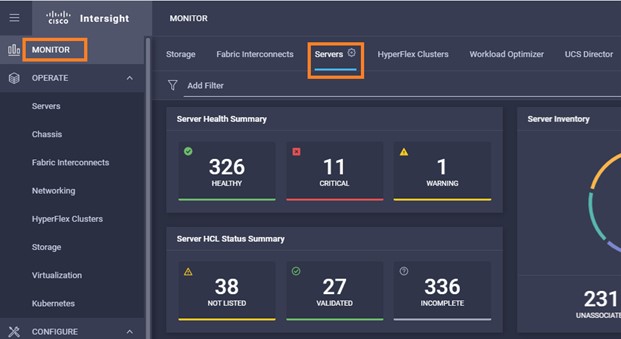
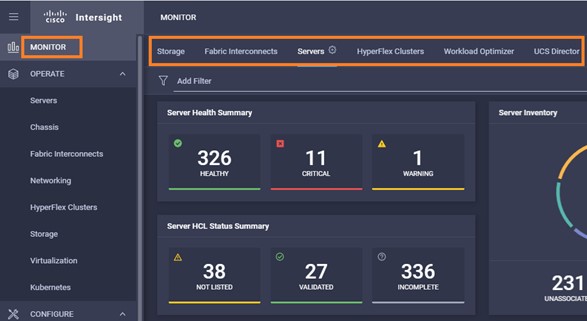
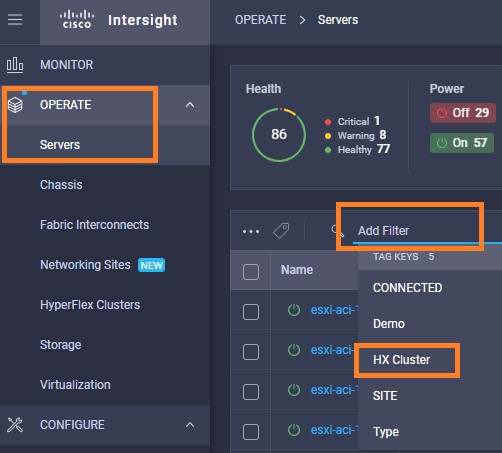
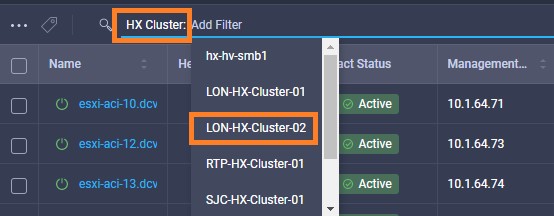
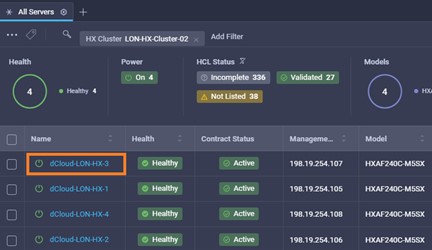
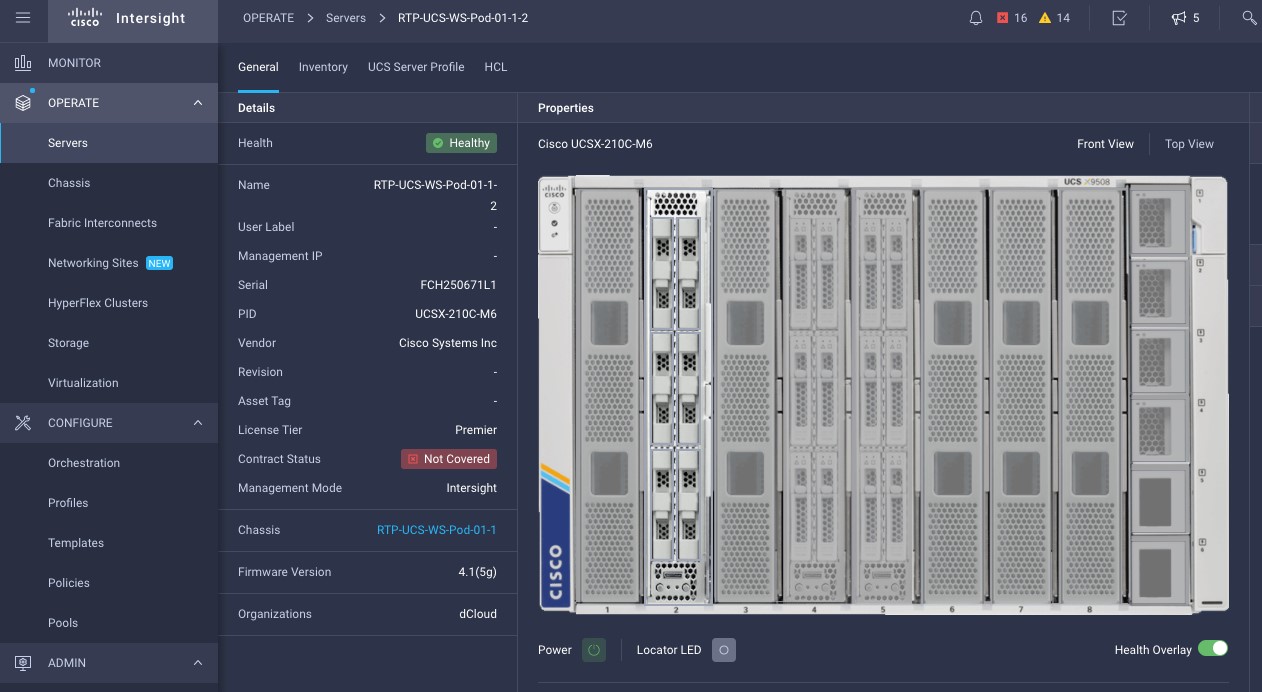
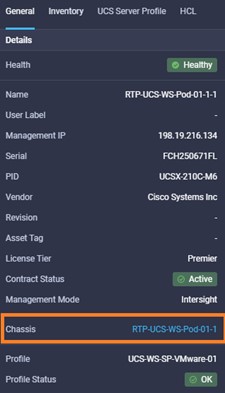
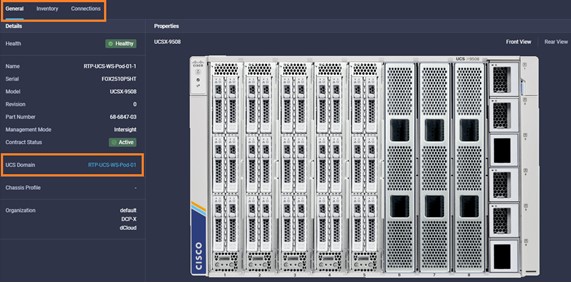
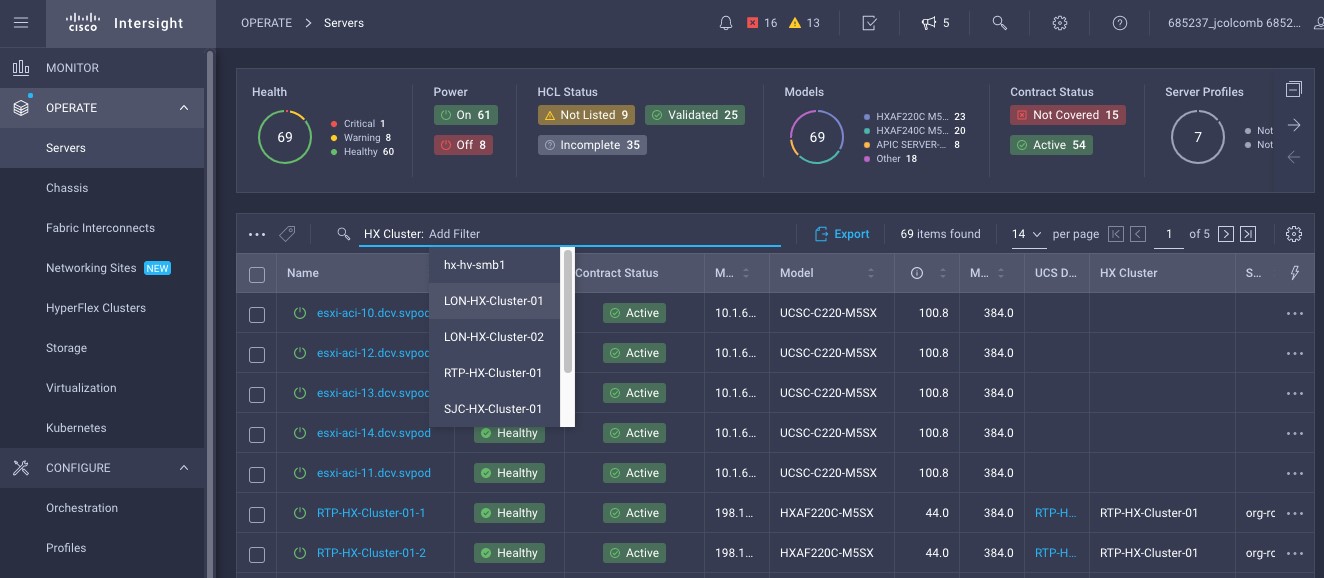
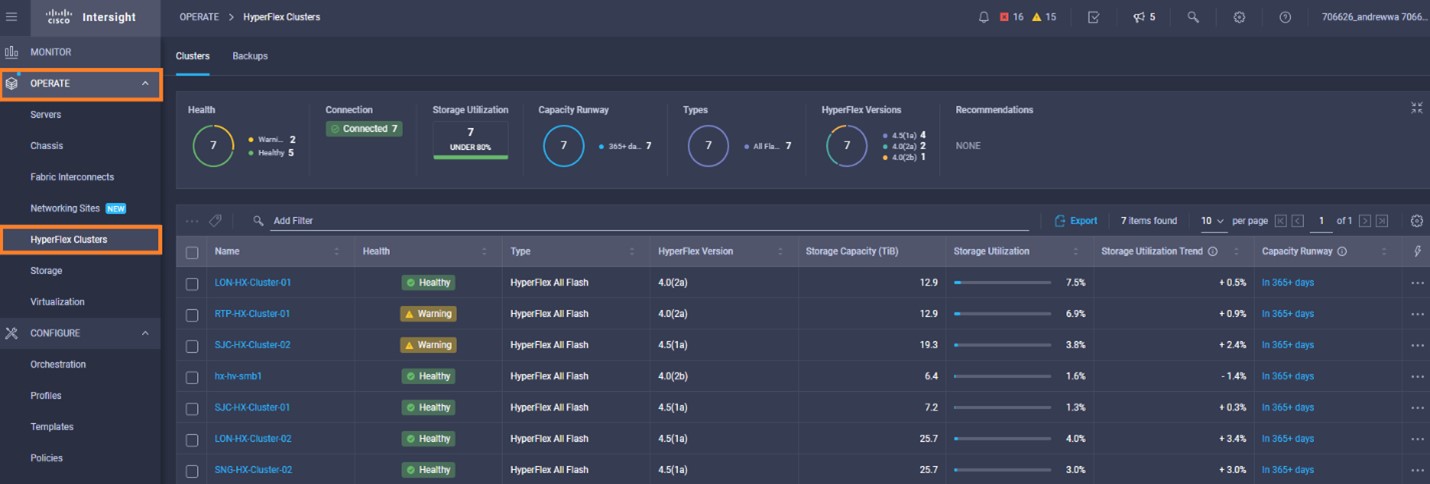
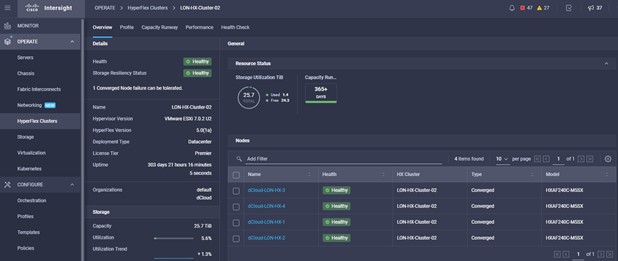
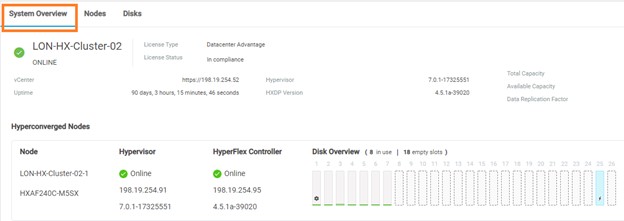
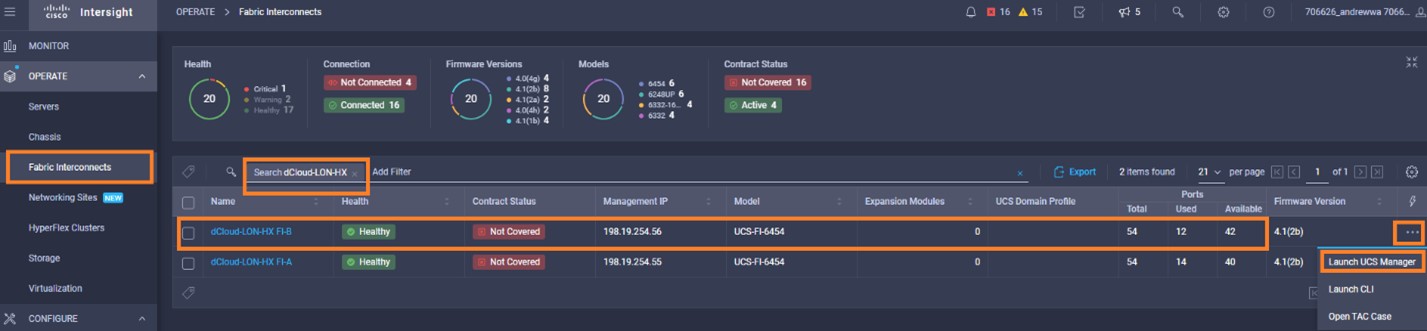
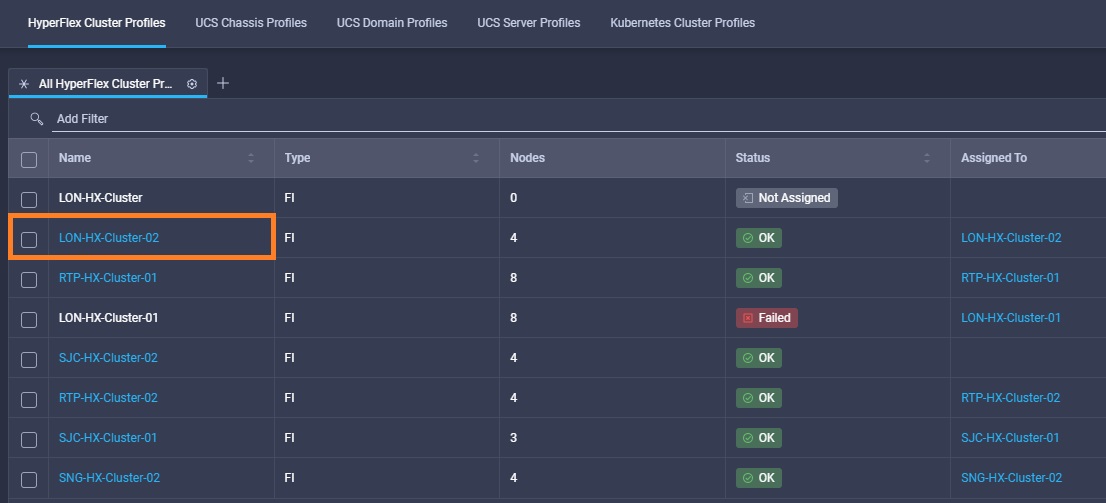
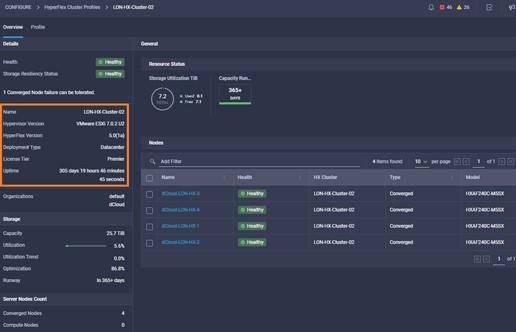
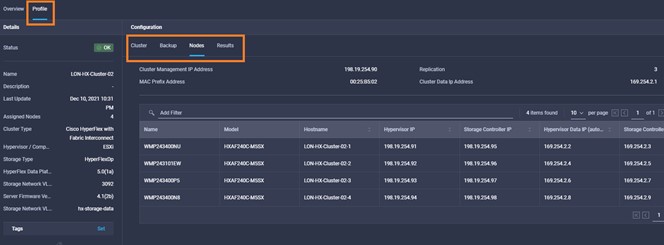
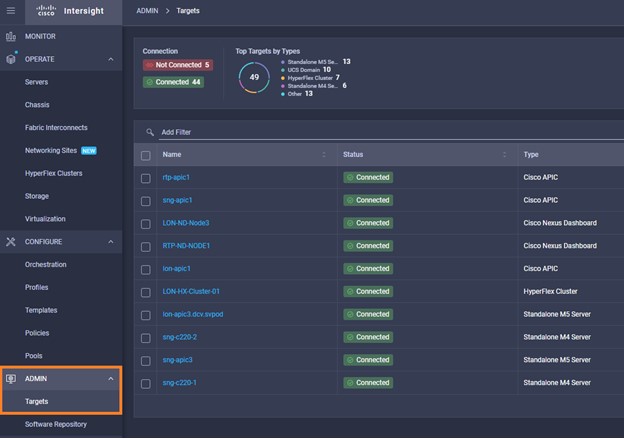
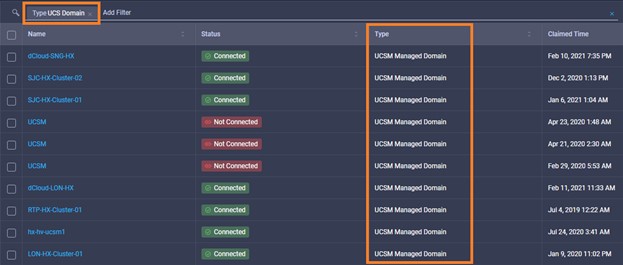
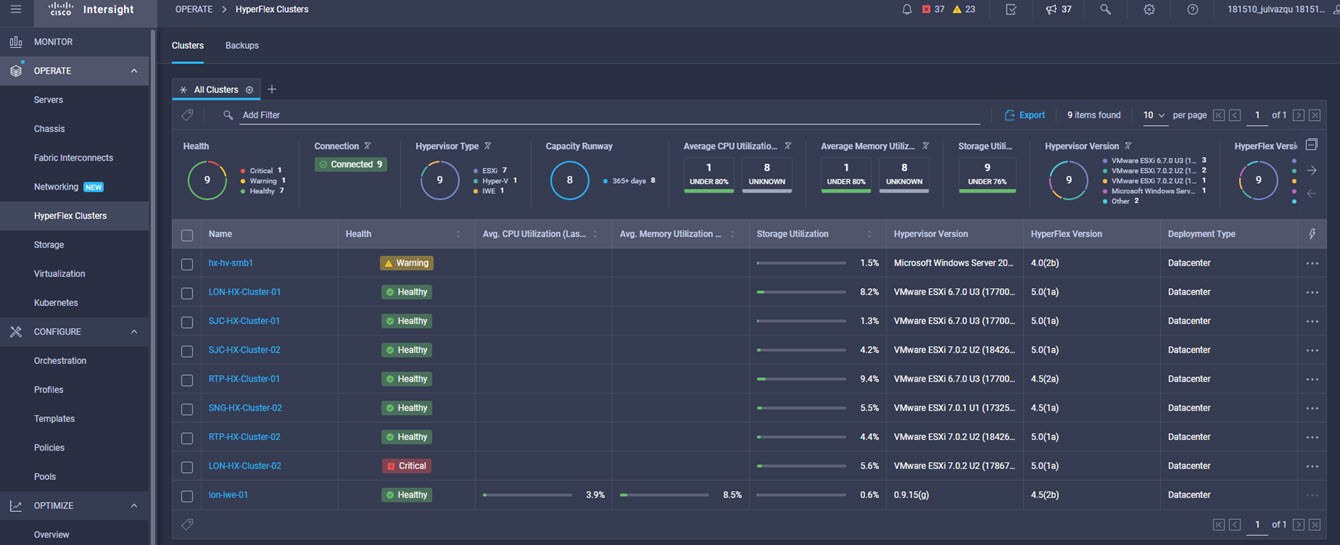
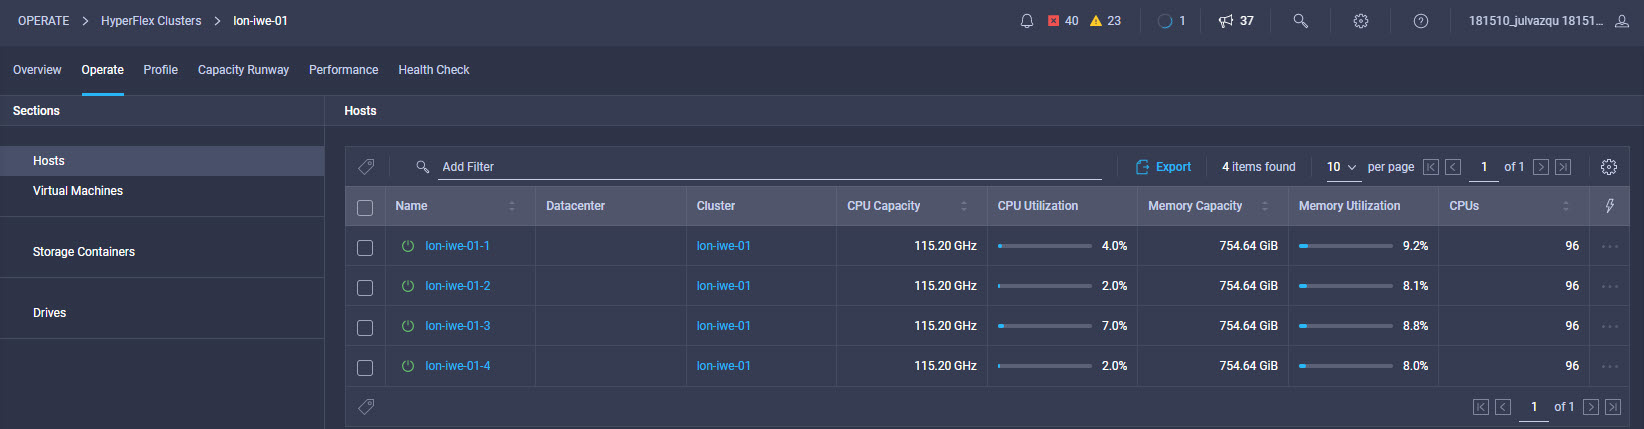
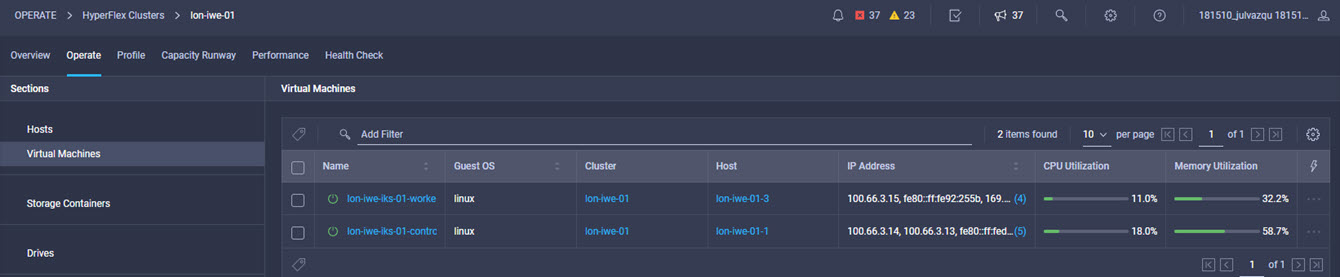
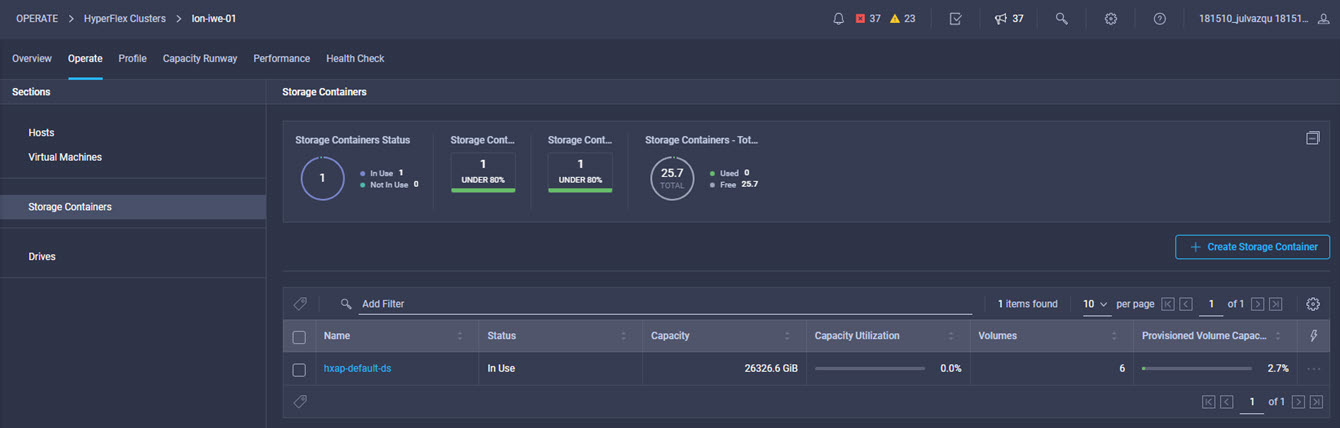
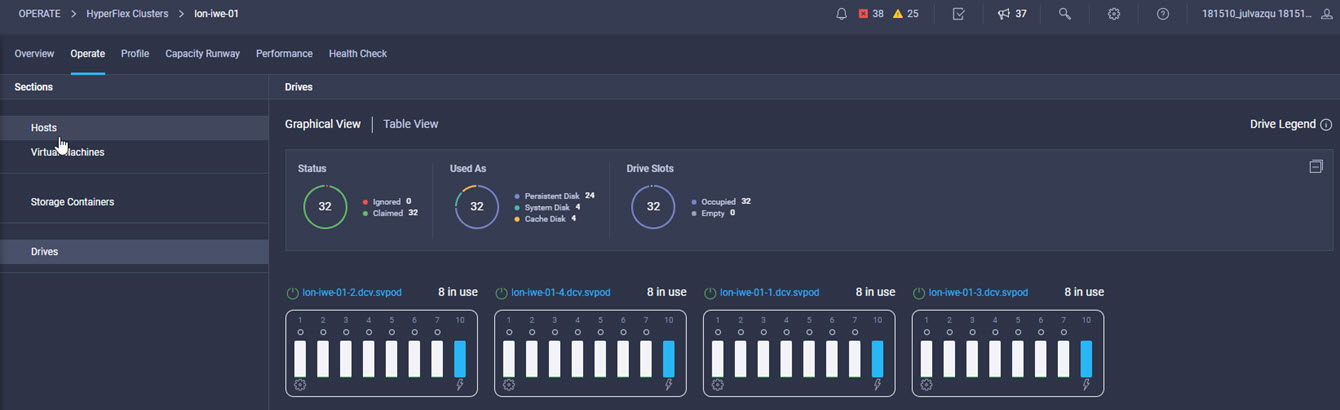
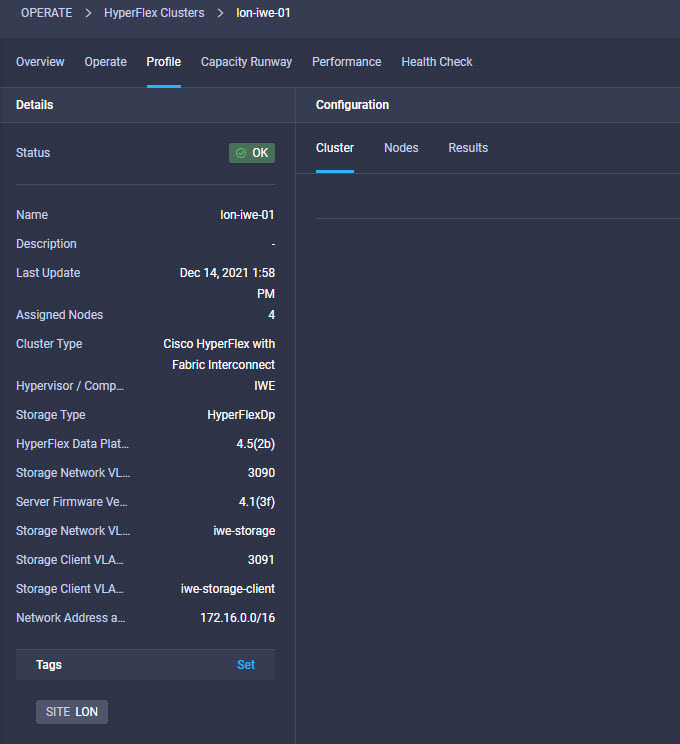
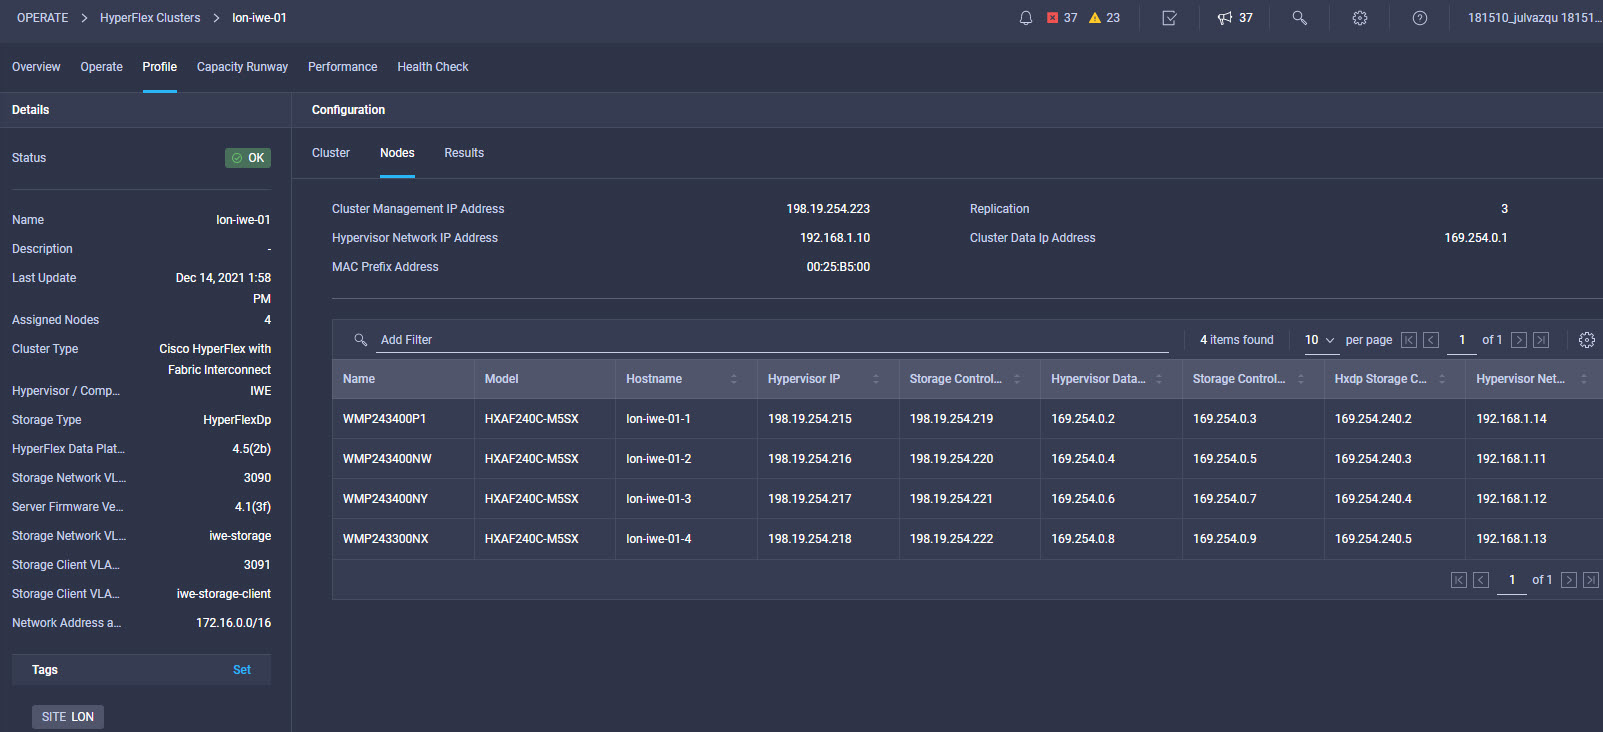
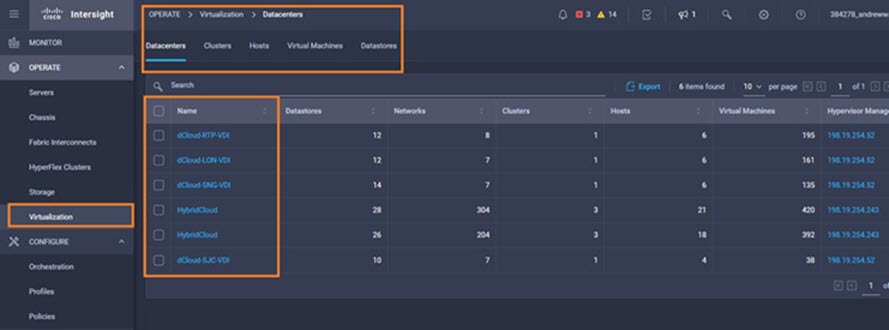
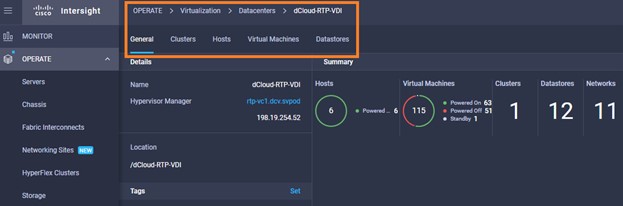
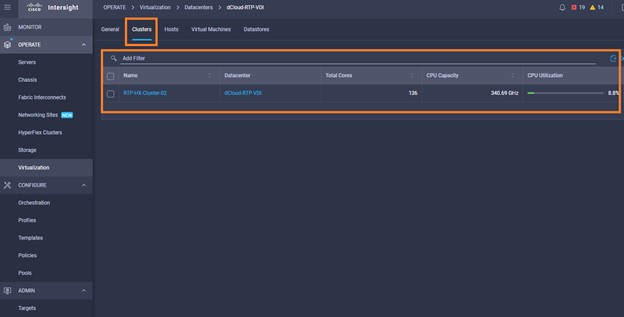
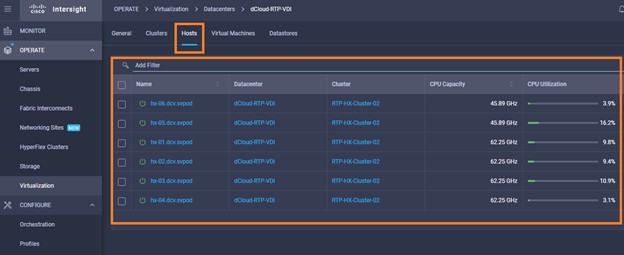
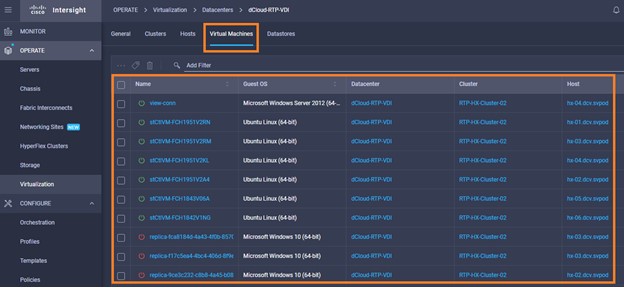
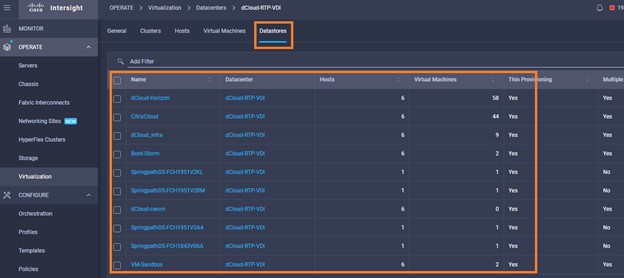
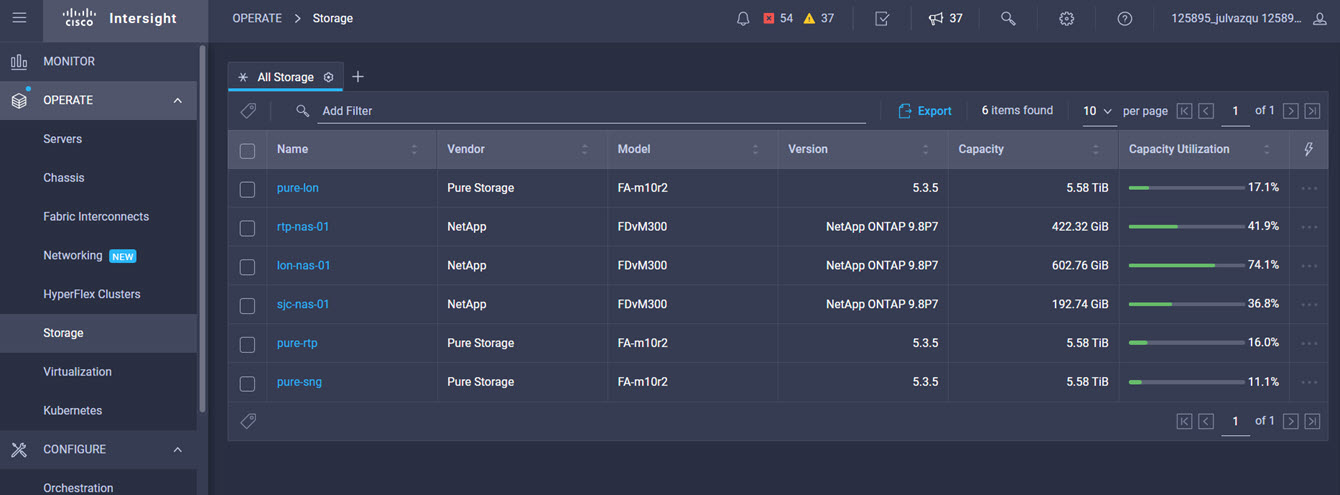
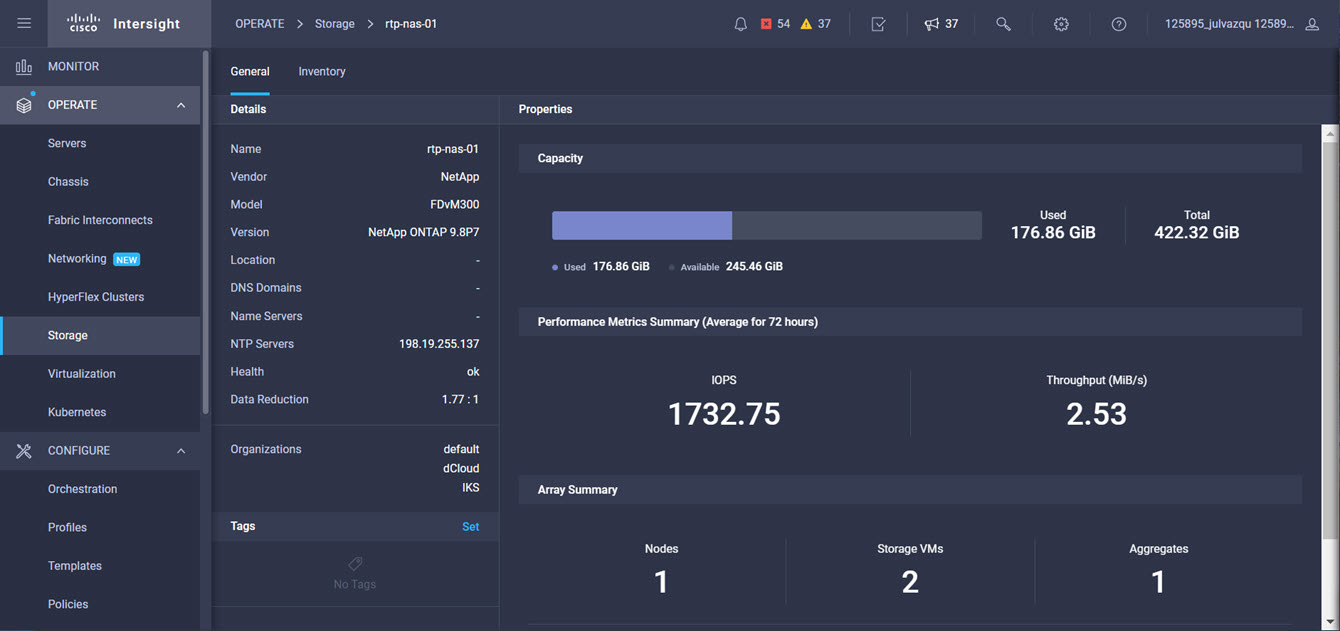
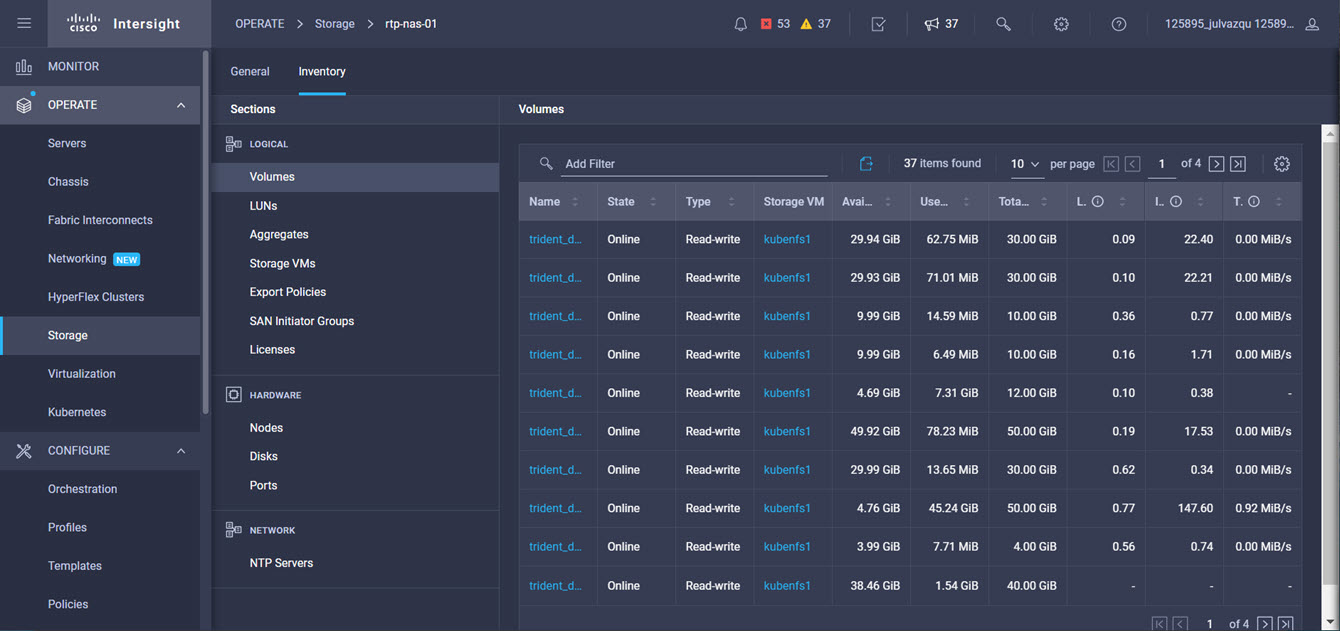
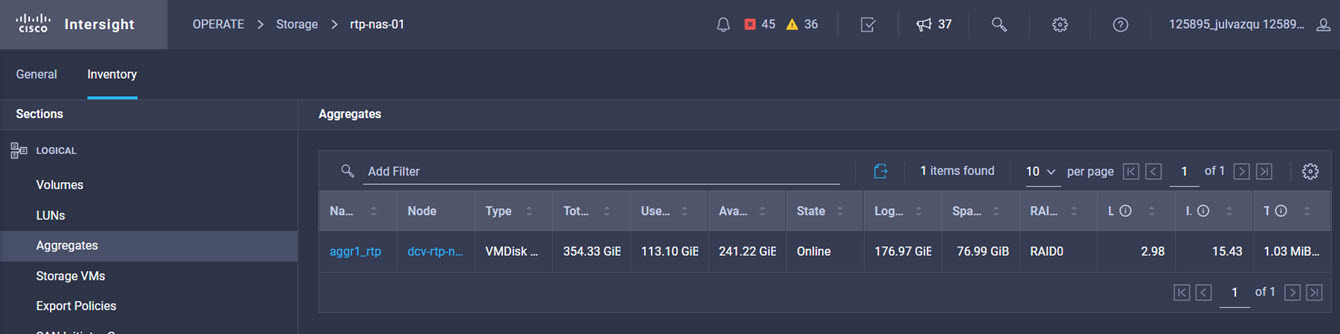
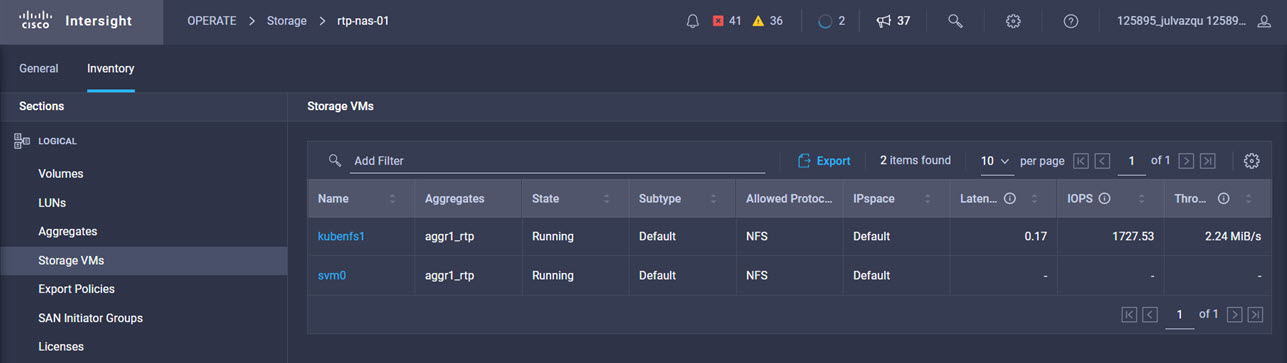
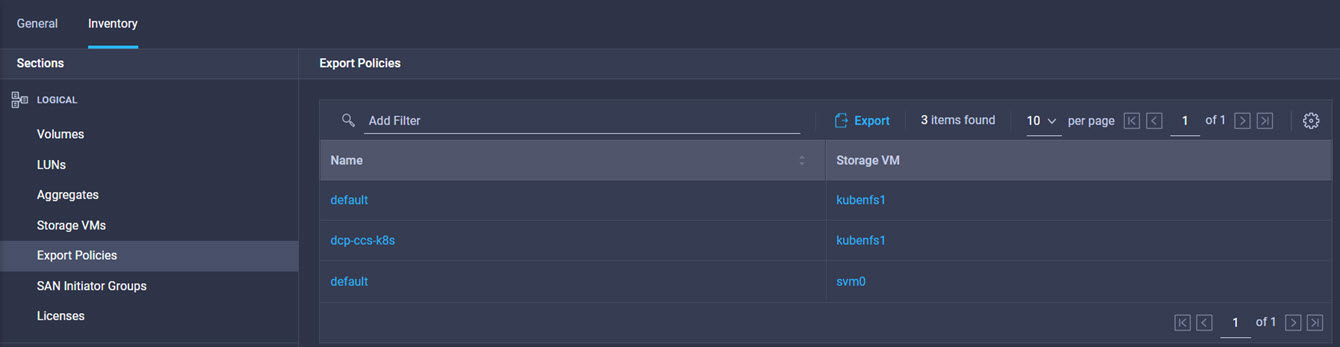
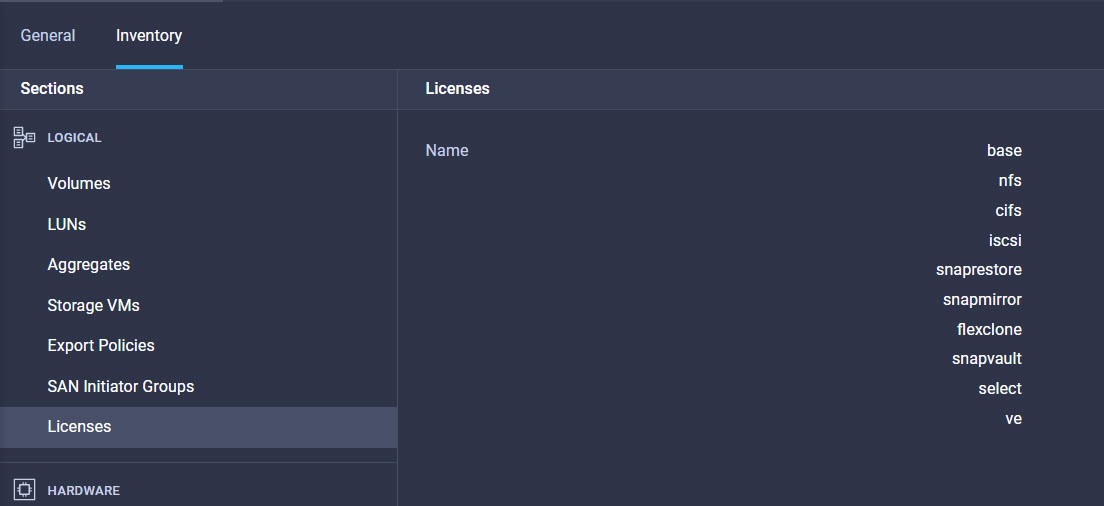
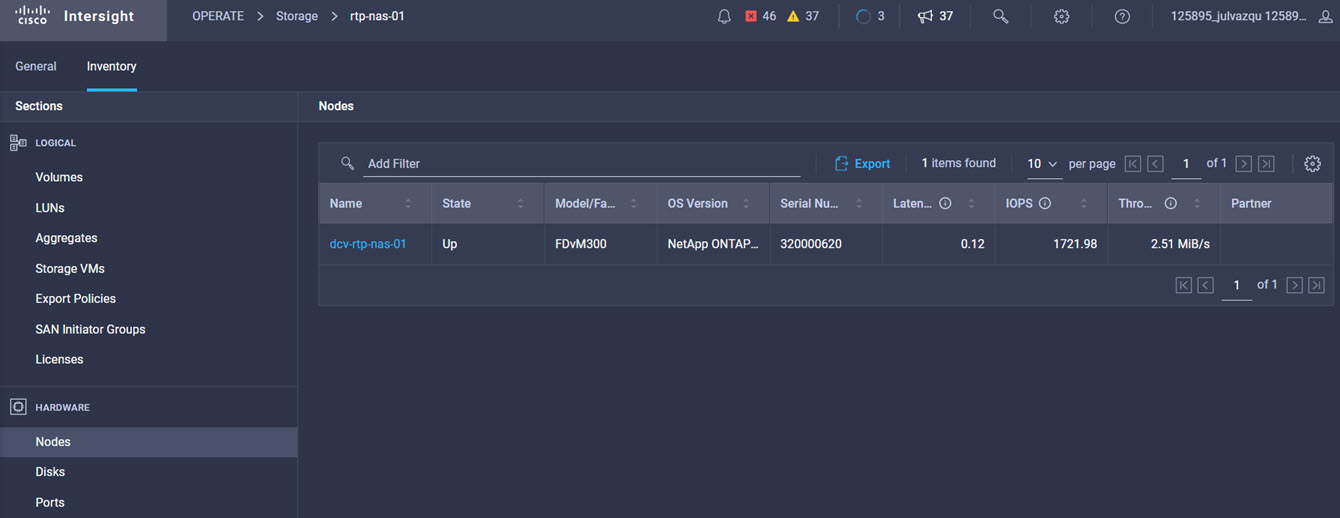
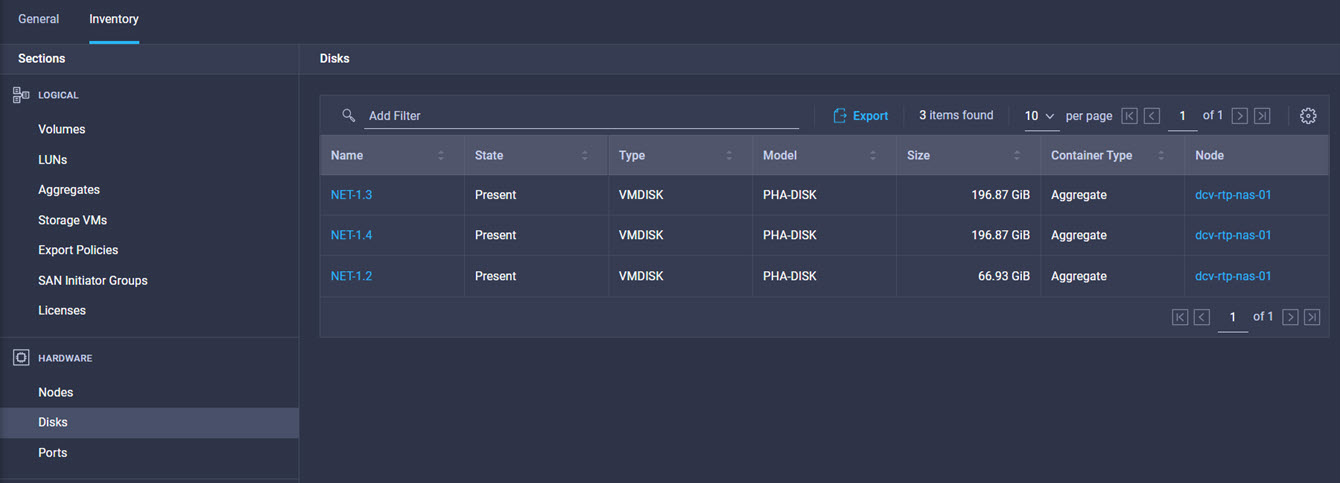
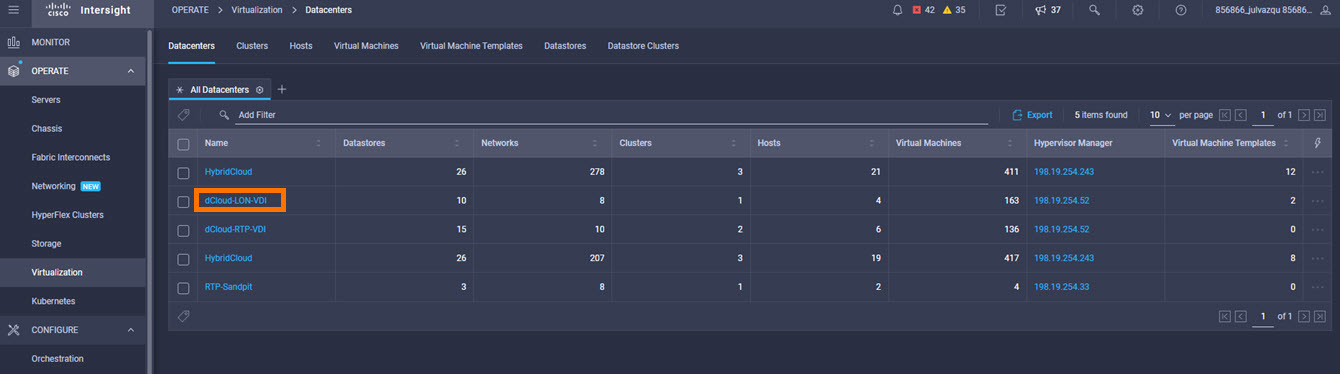
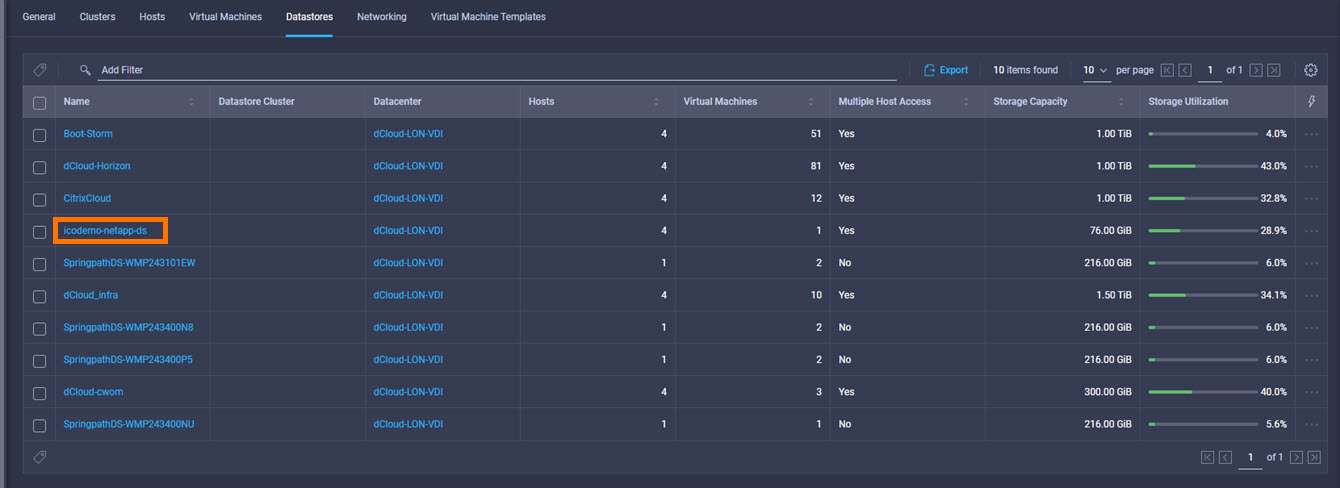
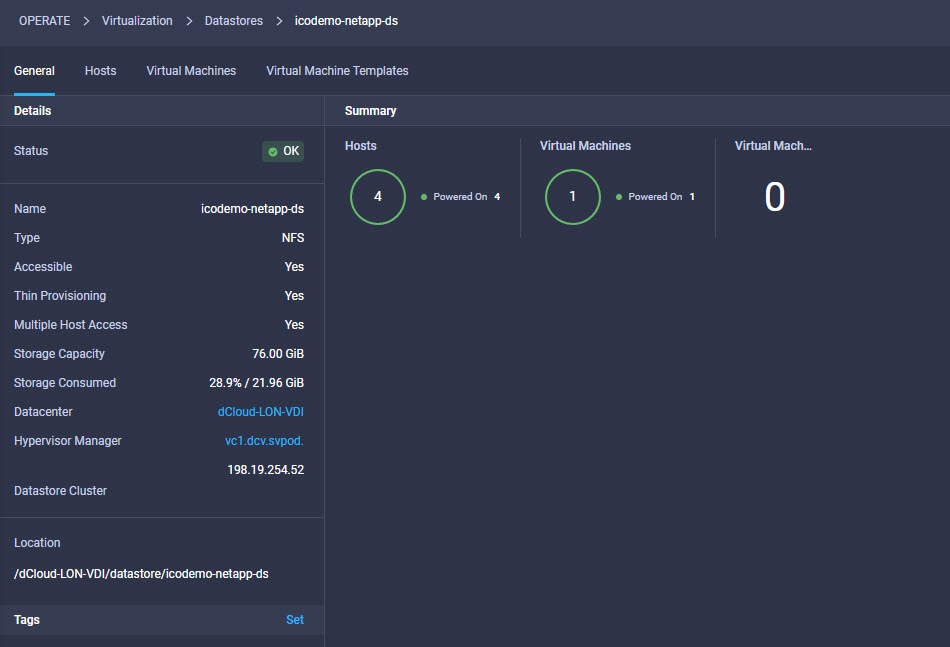
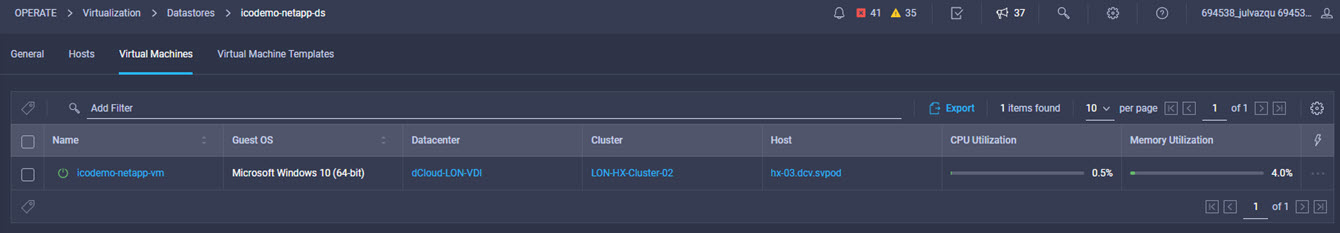
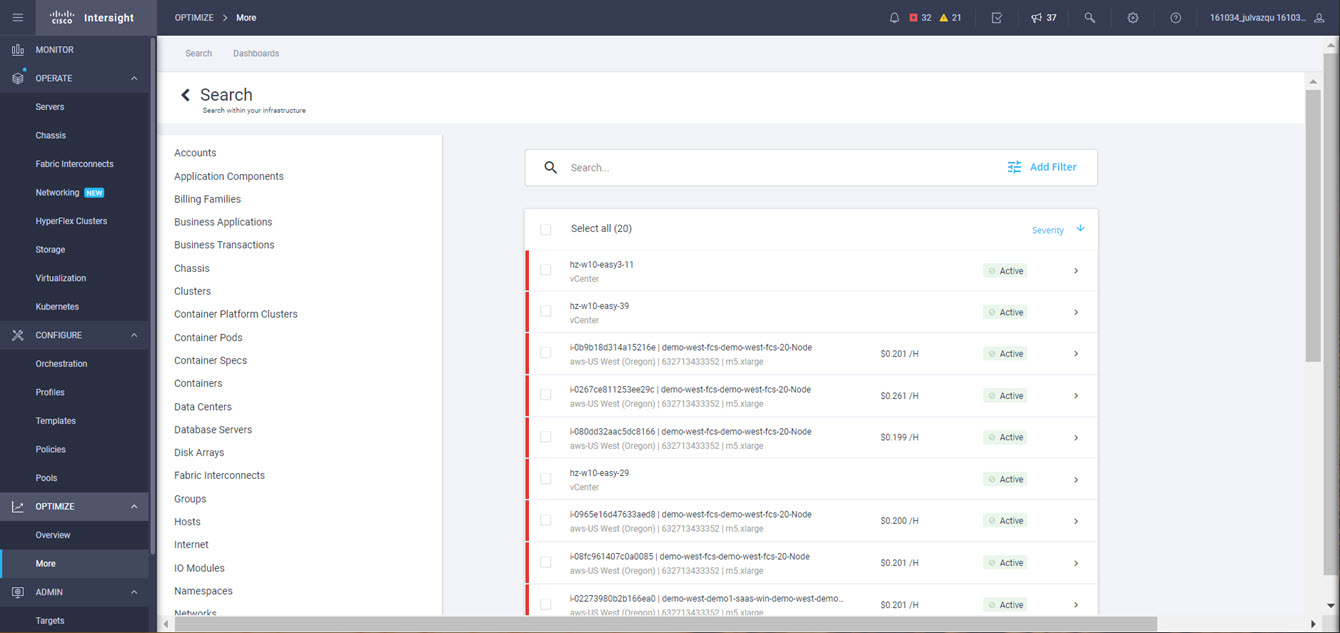
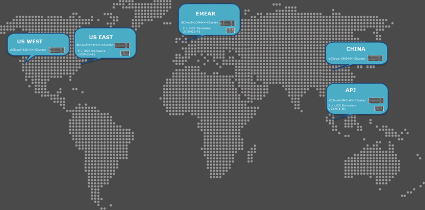
Intersight manages a variety of Cisco dCloud infrastructure (including server HyperFlex clusters, Cisco UCS Domains, VMware vCenters, Pure FlashArrays, NetApp, and Kubernetes) in our data center locations across the world.
Limitations
This demonstration provides a framework for explaining many of the features and benefits of Cisco Intersight, but does not provide administrative access to managed targets.
The available managed infrastructure is real and will vary over time, but dCloud endeavor to always provide access to a good variety of infrastructure to showcase the latest features of Intersight.
Intersight is provided as SaaS and updated each week, therefore, this guide can become outdated; it will be updated quarterly.
Requirements
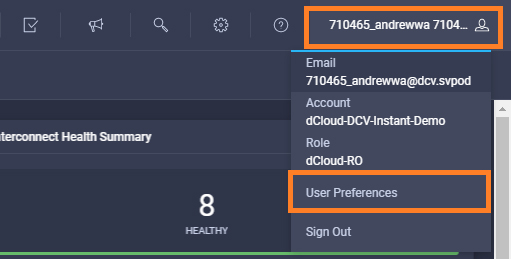
Google Chrome is the recommended browser for this demonstration. Always start your session via the dCloud Catalog, when you click View, the system generates unique credentials and automatically authenticates you to Intersight.