Download Options

Book Title

Command Reference BookMap-1

Chapter Title

This is a command wrapper topic

Cisco HyperFlex 4.5
Published: September 07, 2021
    About

    About

    About this Demonstration

    In this demonstration you are provided Read access to HyperFlex Connect, which is used to manage a HyperFlex cluster located at one of our data center locations.

    Components

    The HyperFlex cluster consists of some of the following components.

    • Cisco HyperFlex Data Platform v4.5

    • Cisco UCS 6454 Fabric Interconnects (x2)

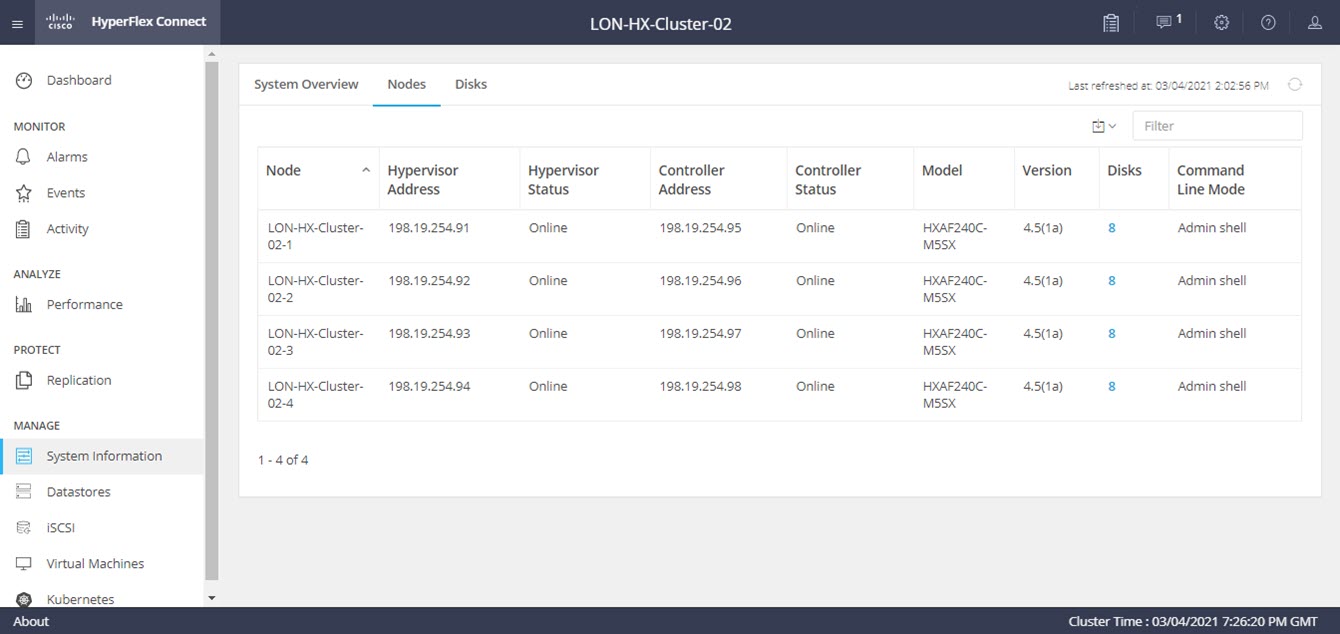
    • Cisco HXAF240c MSSX HyperFlex System (x4)

    About This Solution

    Cisco HyperFlex™ Systems are part of a complete data center strategy that uses hyperconvergence architecture models to solve basic business challenges of data optimization, operational efficiency, and adaptability. Because it is built on the Cisco UCS® platform, it allows unified network management using skill sets that are already present in the organization. It is scalable, adaptable, and completely hyperconverged – providing the three layers of Network, Compute and Storage intelligently integrated into a single solution for faster application deployment.

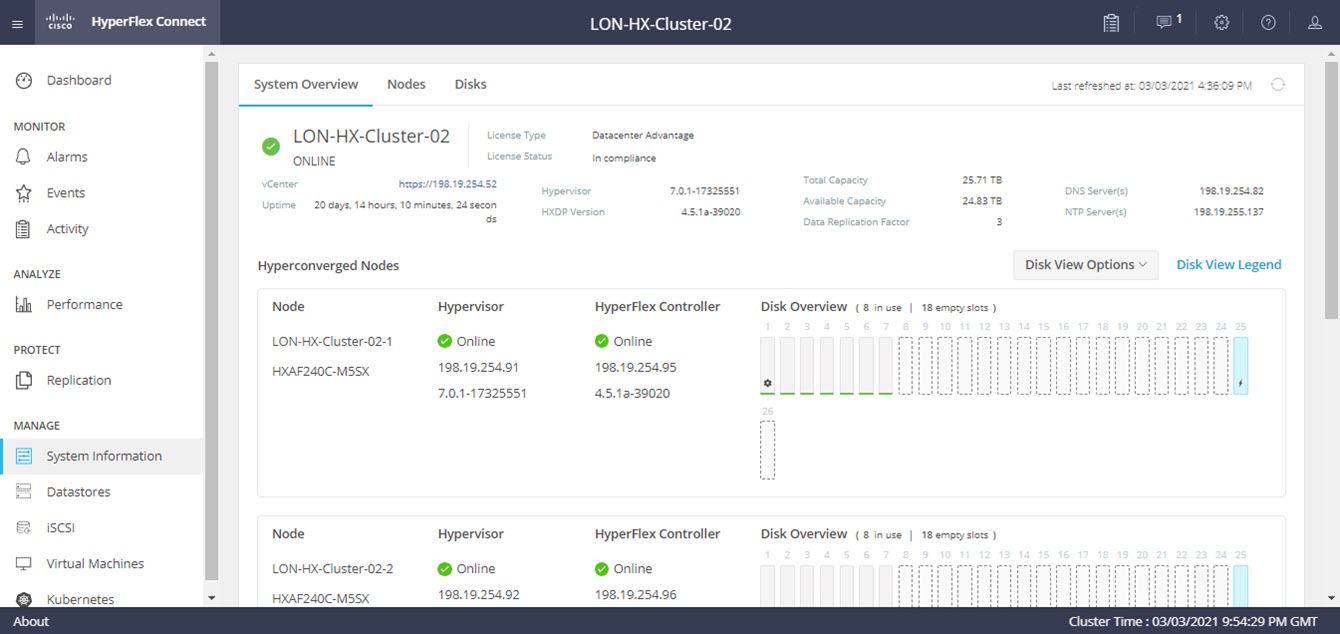
    Cisco HX Data Platform is installed on a virtualized platform such as VMware vSphere. During installation, after specifying the Cisco HyperFlex HX Cluster name, and the HX Data Platform creates a hyperconverged storage cluster on each of the nodes. As your storage needs to increase and you add nodes in the HX cluster, the HX Data Platform balances the storage across the additional resources. Compute only nodes can be added to increase compute only resources to the storage cluster.

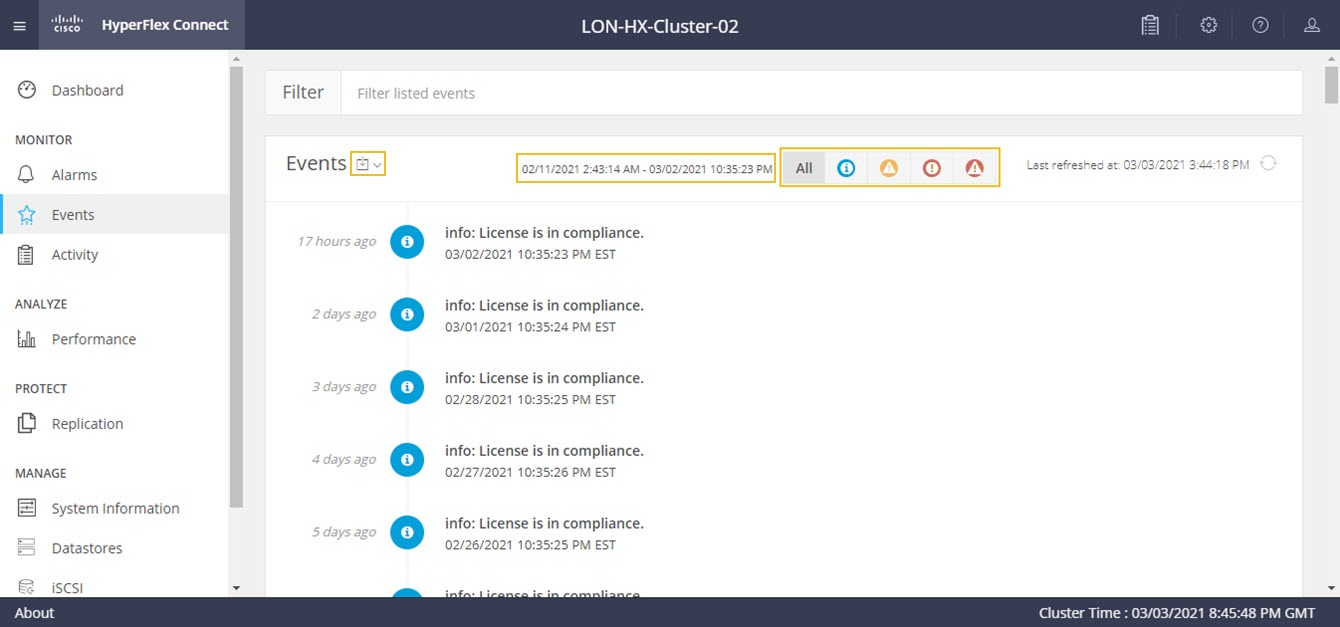
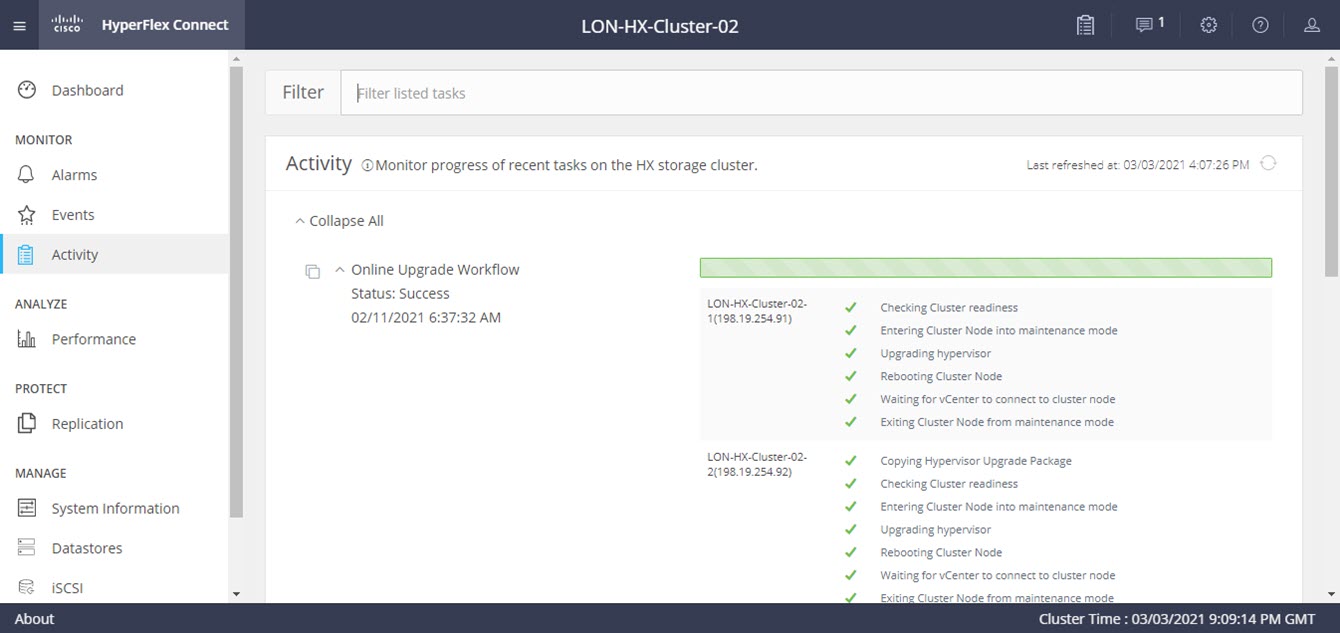
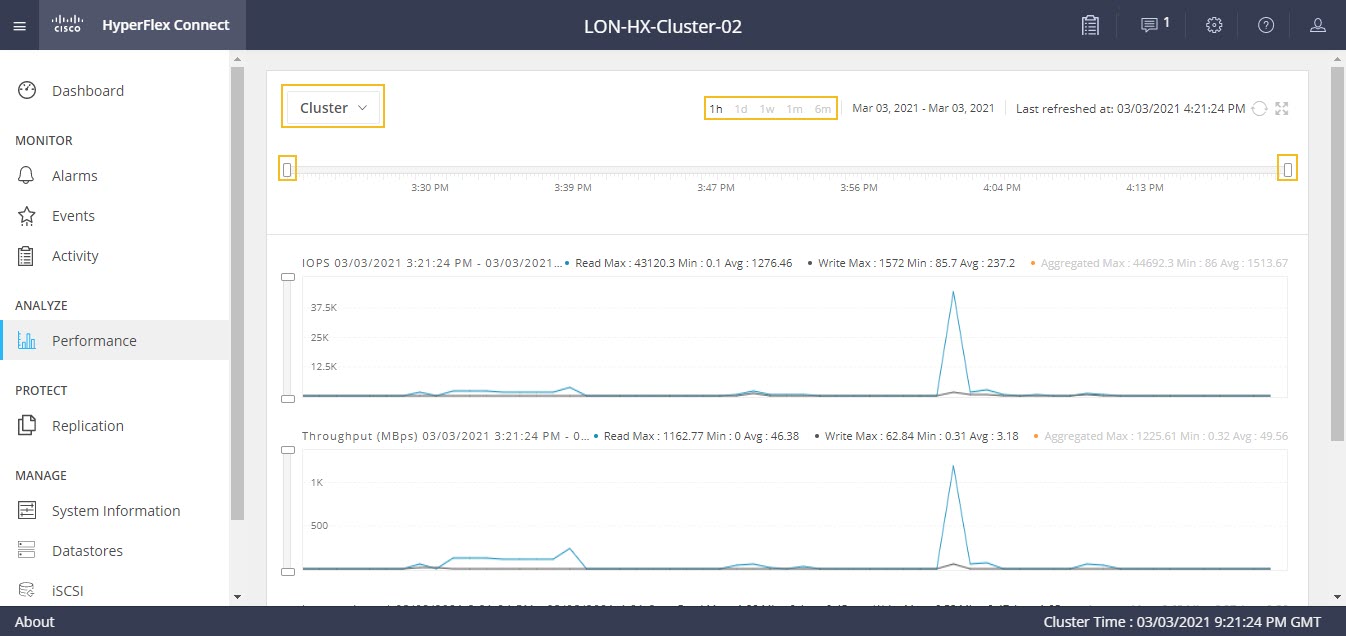
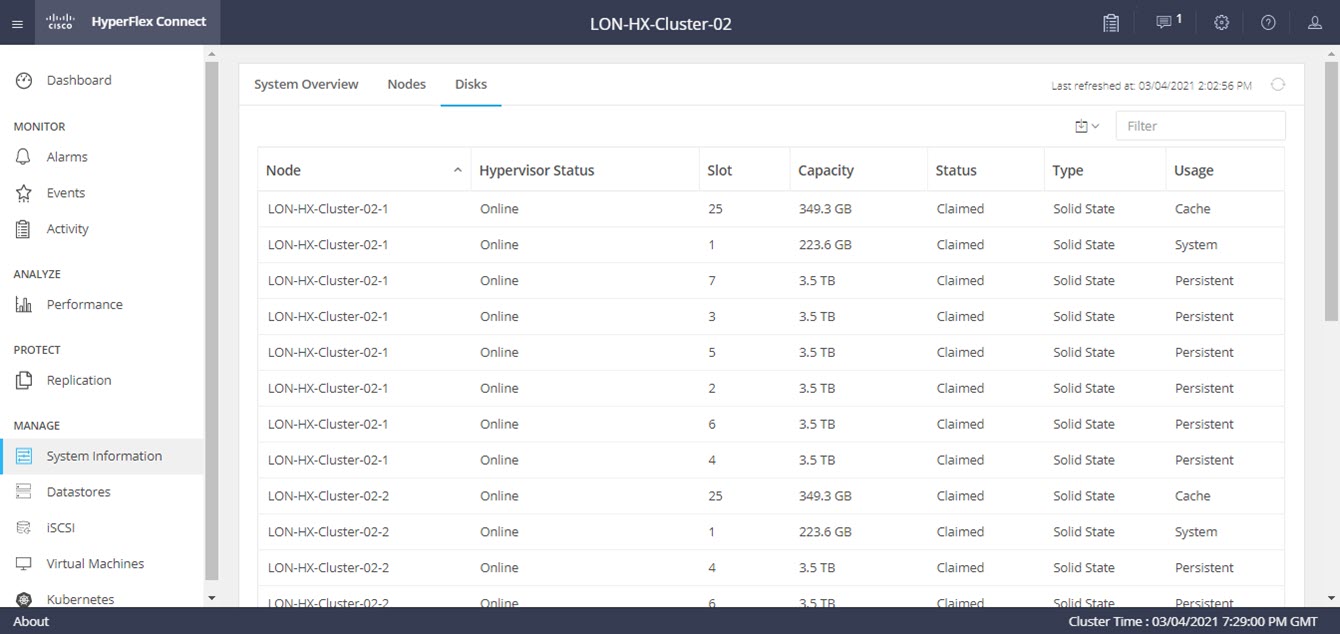
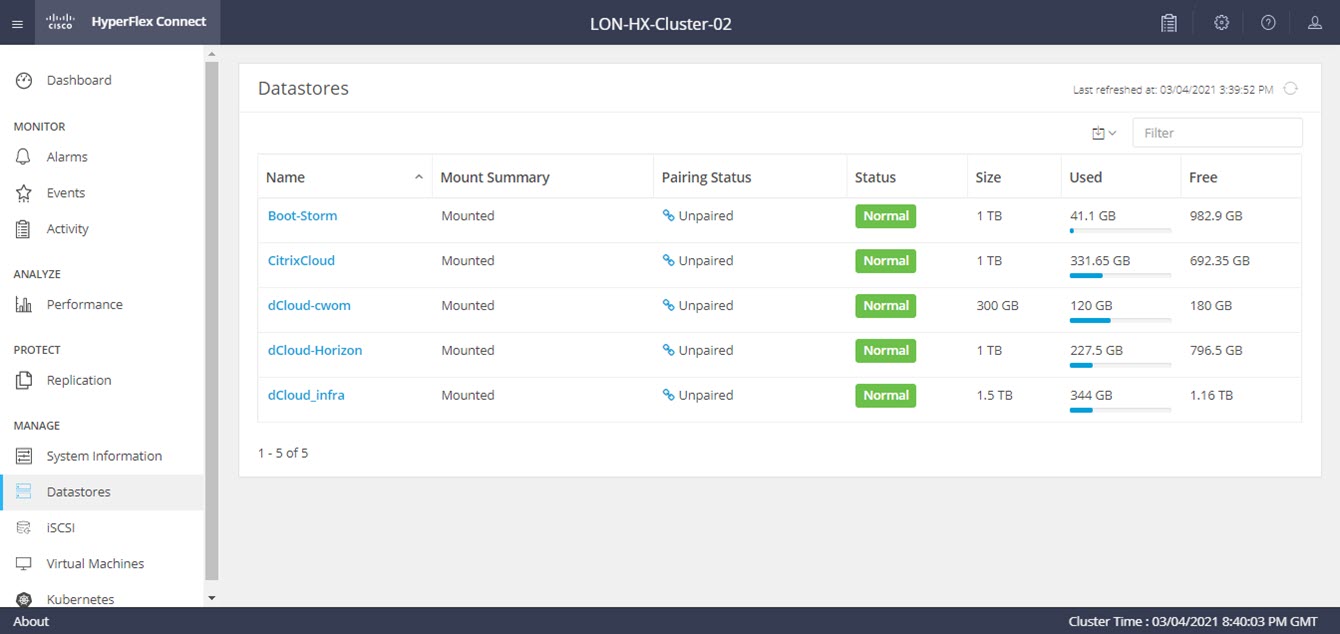
    Cisco HyperFlex Connect provides an HTML5 based access to HX Storage Cluster monitoring, allowing configuration of replication, encryption, datastores, and virtual machines.

    Scenarios

    Scenarios

    Cisco HyperFlex Connect

    Cisco HyperFlex Connect provides robust, secure, and simple management in an intuitive user interface. It lets you manage and monitor your clusters anywhere, anytime, and delivers metrics to support your entire HyperFlex management life-cycle.

    The rest of the topics refer to Cisco HyperFlex Connect as Cisco HyperFlex.

    Dashboard

    This topic describes the information available in the dashboard.

    Procedure


     1   

    Examine the Operational Status, Resiliency Health, the Capacity, and the Nodes.

    The information in each of these areas is a high-level overview. Details are available in other areas of the application.

     2   

    In the Nodes section, hover on the boxes next to Converged to show additional information, such as the node name and IP address, is available.

    As you hover over the boxes, you see the disks that are available in each of the nodes.

     3   

    Look at Resiliency Health.

    The health of the cluster depends on the number of node failures that can be tolerated.

    If the node failure number is exceeded, the cluster will not perform optimally.

     4   

    Look at the VMs section.

    At a glance, you can see the VMs that are powered on, powered off, the number of VMs with snapshots, and the number of VMs that do not have snapshots scheduled.

     5   

    Scroll down and hover over across the performance display to show the information available for the last hour.

    As you hover across, you will see details of the number of reads and writes per second, the throughput, and the latency across the cluster.


    Monitor

    In this section, you will investigate the monitoring features available. All the functions are available in the menu under MONITOR.

    Procedure


     1   

    Click Alarms to display any alarms in the cluster.

    Note: In this demo, there may not be any alarms displayed.

    If there were any alarms triggered in the cluster, they would appear here. The information includes the severity of the alarm, the source, a description, etc.

     2   

    Click Events.

    You can filter the events by clicking the icons at the top of the display.

    Example:

    The display shows all of the events that occurred on this cluster.

    You can download a copy of the events into a .csv or a doc by clicking . You can also change the time frame of the display by clicking the range at the top of the screen and selecting the dates and times.

     3   

    Click Activity.

    The Activity display shows what has gone on with the cluster, including any attempted upgrades on any node and the upgrade status.

    1. Scroll down the display to show the attempted upgrades for the nodes in the cluster.

    You can filter the activities to show only specific activities or nodes.


    Performance

    Procedure


    In the menu, under Analyze, click Performance.

    Example:

    By default, the system displays the performance on the cluster level for the past hour, but you can compress the time even shorter using the sliders on both sides of the timeline. You can show longer time periods by selecting the time frame above display using either the presets or using the calendar function.

    Hovering the cursor across the display shows the performance details at a specific point in time for IOPS, throughput, and latency.

    With the drop-down in the upper-left of the display (currently shows Cluster), you can show the performance of the Nodes, Datastores, or Replication when configured to partner HyperFlex Clusters.


    System Information

    Procedure


     1   

    In the menu, under Manage, click System Information.

    The system displays the System Overview for the cluster.

    The display provides a configuration summary and status of the HyperFlex cluster. A URL is provided to Hypervisor manager.

    Note: 

    While exploring this portion of the display, do not click the vCenter hyperlink because you will not receive a response from that server as the vCenter is only accessible from internal data center network, and is not internet facing.

     2   

    Look at the Hyperconverged Nodes display and note the status of the Hypervisor and the HyperFlex Controller.

    For each node name in the cluster, you see the IP address of these components as well as the software versions currently installed on the node. Optimally, these match the versions displayed in the upper part of the display as all nodes should have the same level of software.

     3   

    Hover over the Disk Overview portion of one of the nodes.

    As you hover over, you see details about each slot in the node. The information includes whether there is a disk in the slot, the details about that disk, including the type of disk, capacity, interface, and how much storage is in use currently.

    This display provides you the ability to quickly identify and replace a failing disk in a node.

     4   

    At the top of the display, click Nodes.

    This display shows the same information as you would see in the System Overview display. However, with administrator rights, if you clicked on the IP address in the Hypervisor Address column, you would see options that would allow you to put a node into maintenance mode, or leave maintenance mode for a node. The maintenance mode is the same as the feature you would see in vCenter.

     5   

    At the top of the display, click Disks.

    The details of the disks in each cluster displays.

    This includes the status of the disk, it's slot number, capacity, and the type of disk in the node.


    Datastores and ISCSI

    This area is useful when an administrator does not have access to vCenter but needs to assign a datastore. This section describes the capabilities but cannot, because the environment is read-only, perform the administrative tasks.

    Procedure


     1   

    In the menu, under MANAGE, click Datastores.

    In an administrative environment, there would be a Create Datastore button you would use to create a datastore. When you create the datastore, it is automatically mounted to all cluster nodes and formatted automatically. Also, there will be Unmount Datastore button. These features allow the administrator to create datastores without knowing the underlying commands or IP addresses required; the system handles it for them.

    The display shows the details of the name, size, and utilization of the datastore.

     2   

    In the menu, under MANAGE, click ISCSI.

    There is no ISCSI configuration in this environment, so the display is blank. The HyperFlex iSCSI Target Service is available in HyperFlex 4.5(1a). Supported use cases for the HX iSCSI Target Service are:

    • Support fail-over clustering, such as Microsoft Failover Clusters, for applications that require highly available shared storage, including Microsoft SQL Server and Hyper-V

    • Present block storage to applications running inside or outside the HyperFlex cluster, such as Oracle Database or Oracle RAC deployments on external compute hosts

    • Support Microsoft Exchange deployment over iSCSI

    • Provision persistent volumes for Kubernetes through the HyperFlex Container Storage Interface for Kubernetes


    Virtual Machines, Replication, and Support

    Procedure


     1   

    In the menu, under MANAGE, click Virtual Machines.

    All of the virtual machines that are part of the cluster display. You see the status of each VM and other pertinent information such as the IP address, the operating system, and the number of any snapshots. Some of the VMs are powered off, in which case the IP address is unavailable.

    In an administrative environment, you would be able to power the VMs on or off.

     2   

    Scroll to the bottom of the page to quickly review the other VMs and note the number of VMs in this cluster.

     3   

    At the bottom right of the page, click any of these controls 
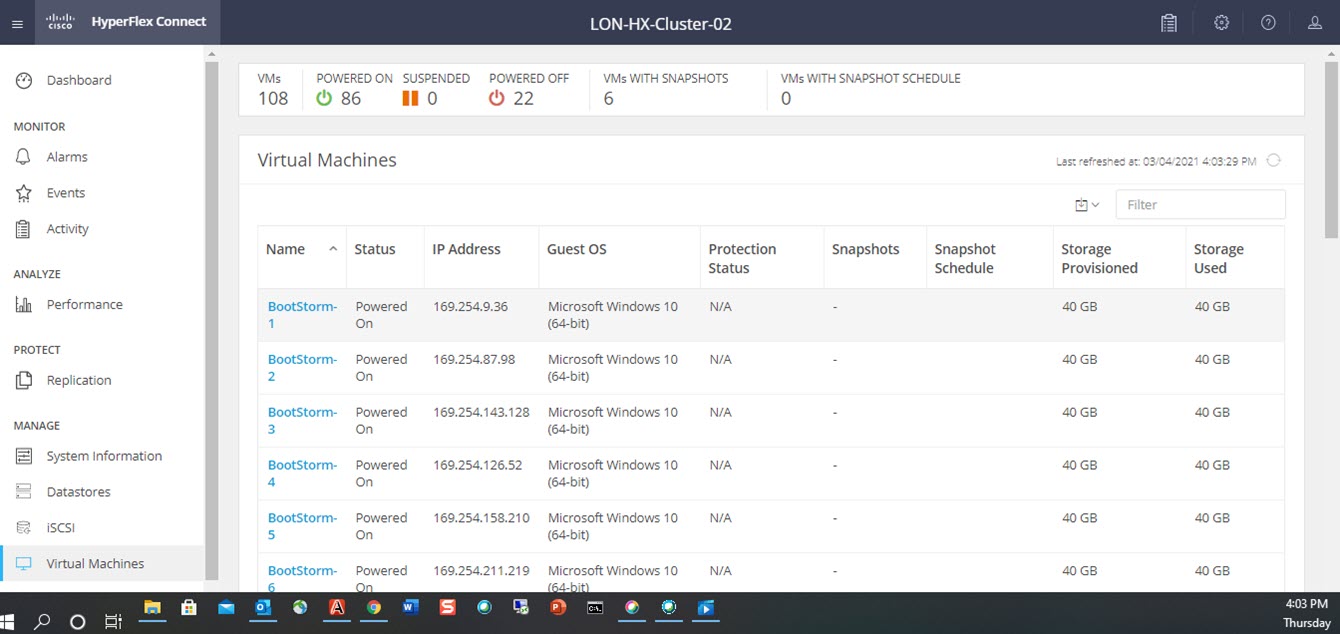
to page through the other VMs.

     4   

    In the menu, under PROTECT, click Replication.

    In an administrative environment, you would use this area to define the configuration to replicate this Virtual Machines, in groups or individually, with another cluster for disaster recovery.

     5   

    At the top of the screen, click .

    The Support Bundles option displays.

    When there is a problem that you have reported to TAC and they request a support bundle, clicking Support Bundles creates the required log bundle that you send to TAC.


    Was this page useful ?
    Was this page useful ?
    Email*
    Enter Valid Email Address
    What can we do to improve your experience?
    Help us with more info.*


    *Required field
    Was this page useful ?
    Email*
    Enter Valid Email Address
    What did you like about it?
    *Required field
    The feedback has been submitted successfully!